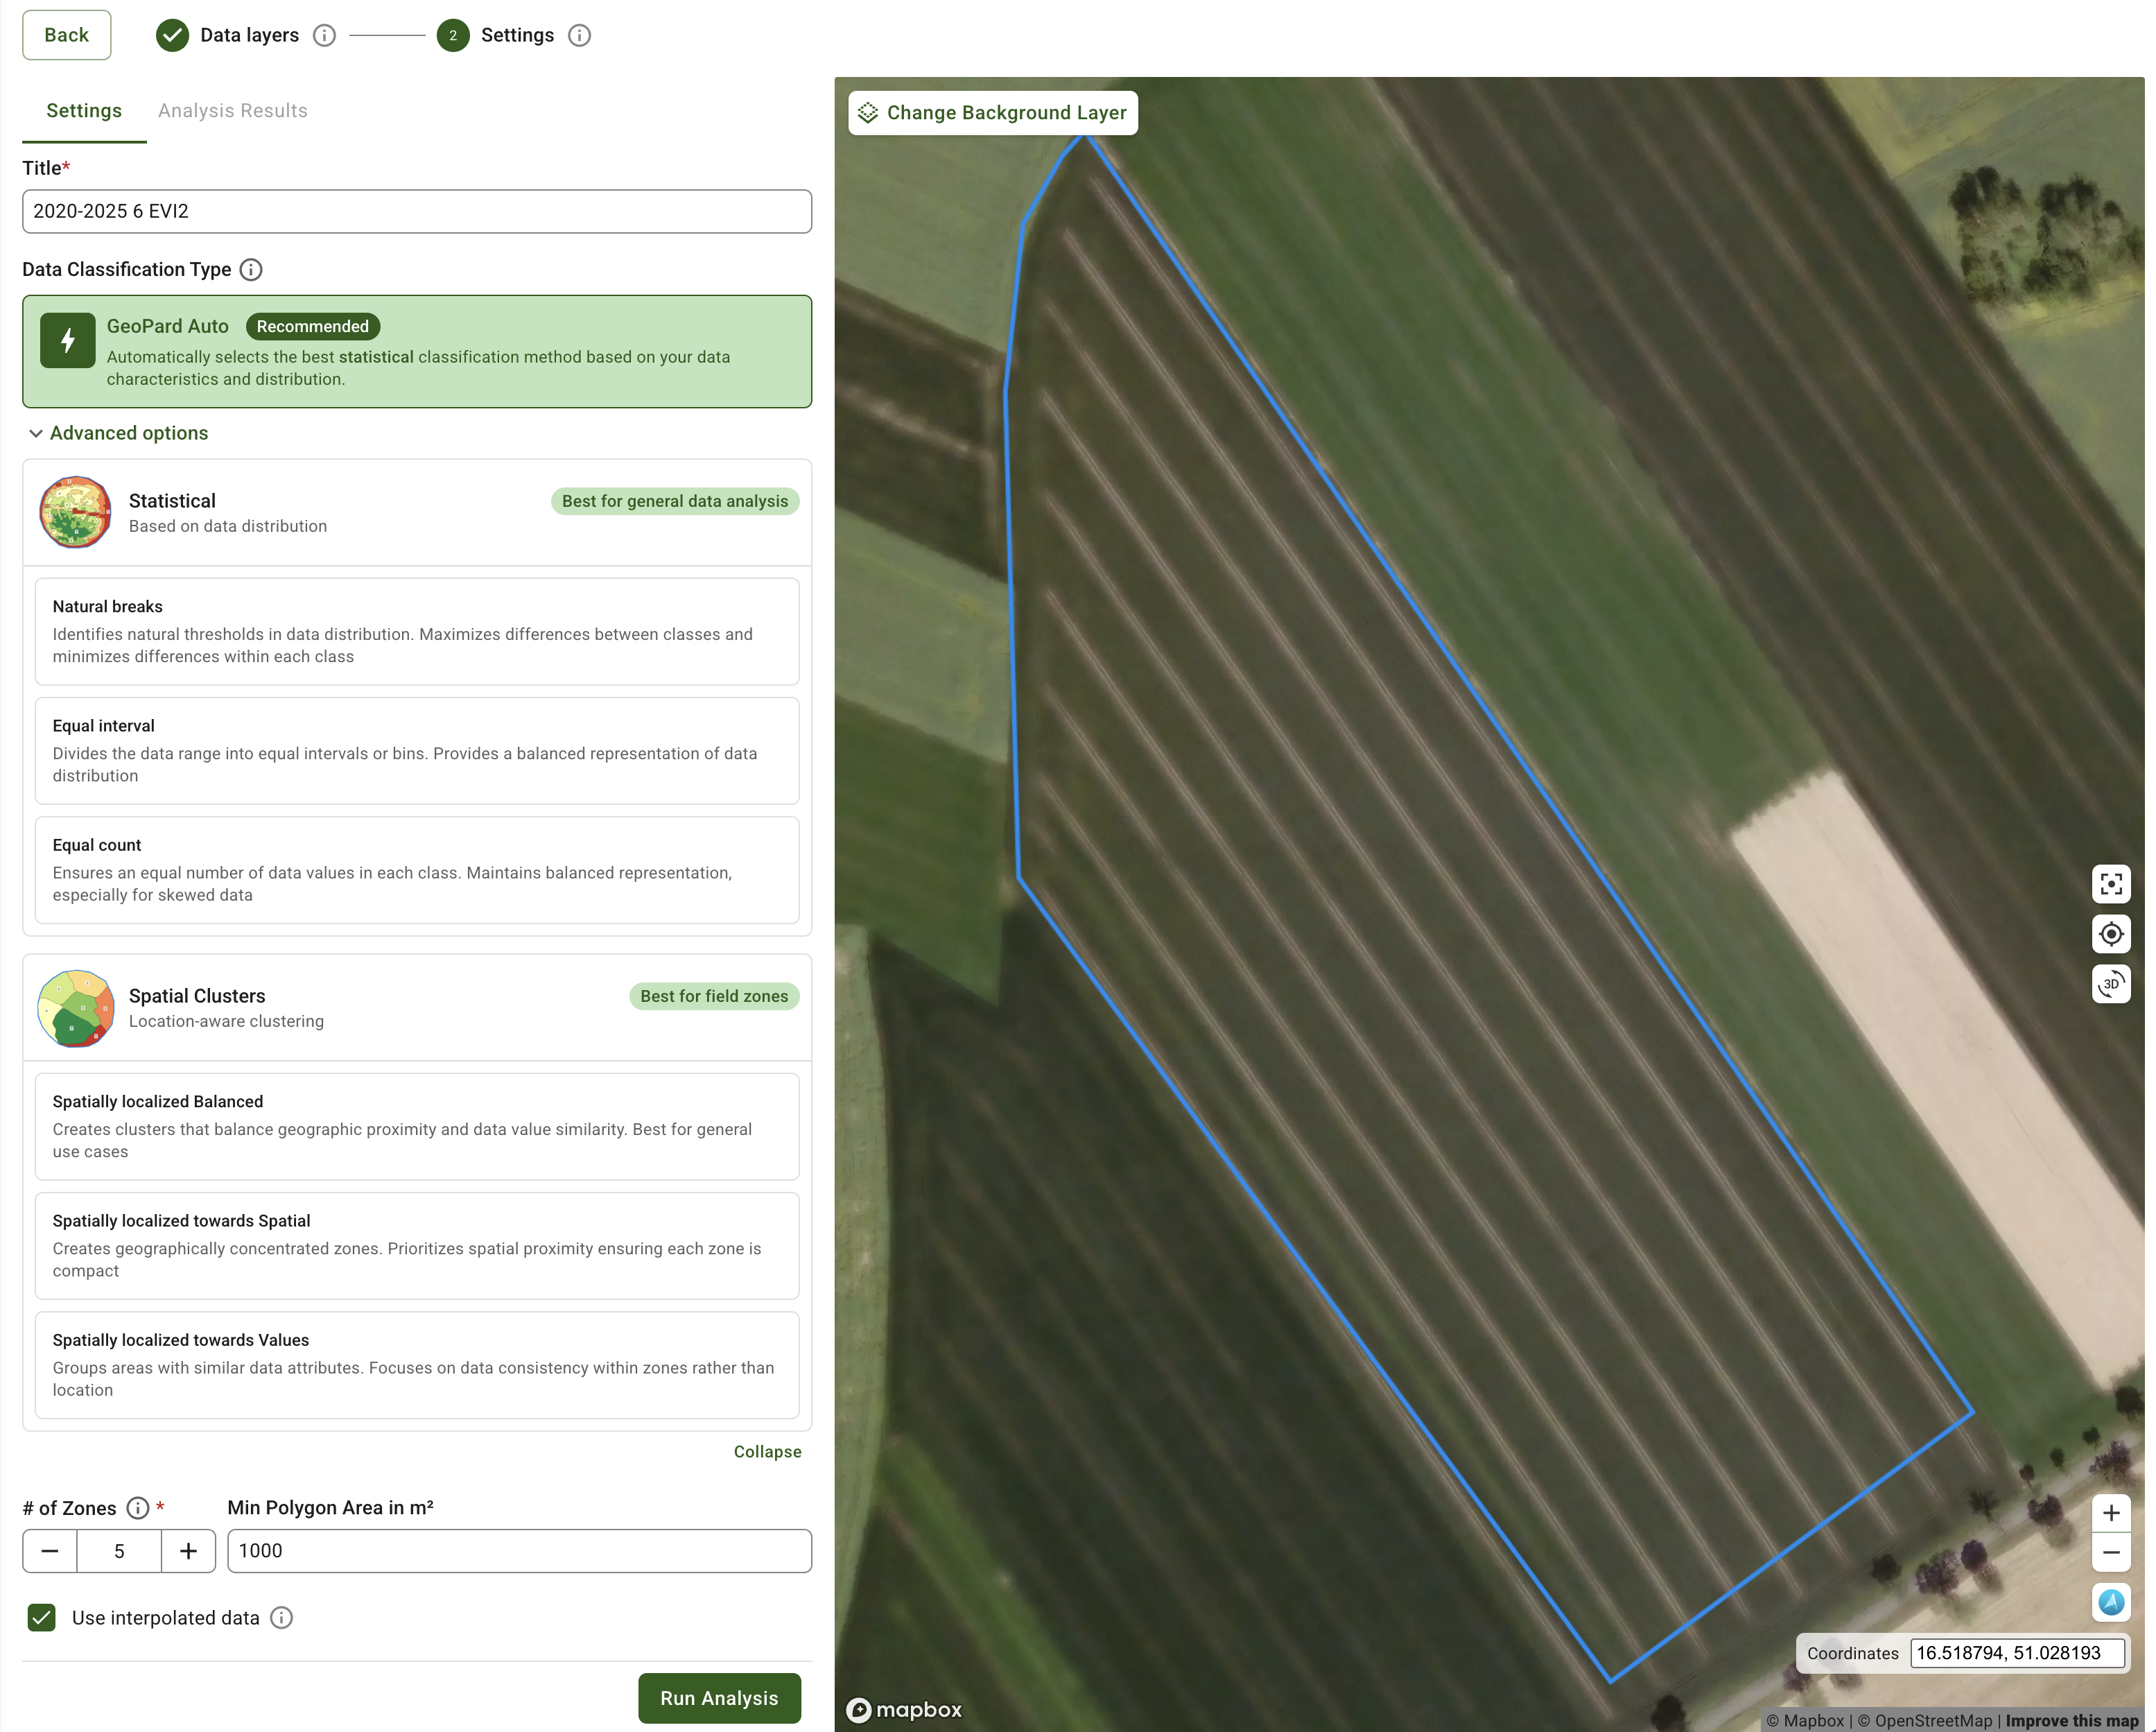
GeoPard Tutorials | Precision Ag Software
  • Introduction to GeoPard
    • GeoPard Platform: Frequently Asked Questions (FAQ)
  • 🖥️Product Tour - Web App
    • Getting Started
      • Create a new farm
      • Draw a new field
      • Upload a field boundary
      • Edit a boundary
      • Edit a field name
      • Add a label
    • 🛰️Satellite Monitoring
      • Order Planet Scope (3m daily) imagery
      • Indices for Crops and Soils
      • 📈Crop Development Index Graph
    • 📊Zones Maps and Analytics
      • Assign Variable Rates in the Zones (Ag inputs Rates Distribution Tool)
      • Creating Zones Map using Satellite Imagery
      • Creating Zones Map using Soil/Yield/As Applied Data
      • Creating Zones Map using Topography
      • Creating Zones Map using a Template
      • Draw Zones Manually, Clone from an existing layer
      • Usage of Data Classification
      • Edit Zones Map: Merge & Split
      • Multi-Year Zones
      • Multi-Layer Analytics
      • Compare layers
      • Heterogeneity factor
      • Relative variation factor
    • 📊Equation-based Analytics
      • Batch Equation analytics
      • Catalog of Predefined Agronomic Equations
      • Catalog of Custom Functions
    • ⛰️Topography
    • ⛰️3D Maps
    • Import
      • Field Boundary
      • Soil Data
      • Yield Data
      • As Applied/As Planted Data
      • Machinery Proprietary Formats
      • Import from MyJohnDeere
    • Export / Download
      • Field Boundary Export
      • Batch Export of Boundaries, Zones and Scouting Pins
      • Zones Map Export as shapefile
      • Satellite Imagery Export as geotiff or geojson
      • Export Scouting Notes as shapefile
      • Export VRA map In ISOXML Format
      • Export to MyJohnDeere
    • 🤖API
    • Operations Log - Track errors/Imports and Analytics
    • Organizations and Roles
    • Farms Sharing between Accounts & Organizations
    • Managing Crop Season information with tags(labels)
      • Case: Managing fields for several clients
      • Case: Season details including crop and year
      • Case: Field operation details
    • ⚙️User Settings
      • Subscriptions, Account limits & Plans
      • Restoring password
      • Order the package
      • Changing preferences
    • 🚜John Deere Operations Center Integration
      • 🚜John Deere Operations Center Integration
        • 1. Create Free Trial Account with you John Deere Account
        • 2. Connect to JohnDeere Operations Center
        • 3. Connect to John Deere Organizations
        • 4. Import into GeoPard from John Deere Operations Center
        • 5. Configure Automated Data Sync
        • 6. Export Rx Maps to John Deere Operations Center as Files
        • 7. Export Field Boundaries into John Deere Operations Center
          • 7a. Organization configuration of export boundary to John Deere Operations Center as File
        • 8. Export Rx Maps to John Deere Operations Center as Work Plans
        • 9. Export Soil, Topography, Satellite or Analytics as Map Layers
      • 🚜John Deere Operations Center Data Sharing
        • 1. "Staff Member" sharing
        • 2. Problem-solving of "Staff Member" sharing
        • 3. "Partner Organization" sharing
        • 4. Problem-solving of "Partner Organization" sharing
        • 5. Problem-solving of import from John Deere to GeoPard
        • 6. Problem-solving of Work Plan creation
        • 7. Sharing Fields/Boundaries Between Partner Organizations in John Deere Ops Center, DataSync config
  • 🚀Changelog & Product Releases
    • Release Notes
      • Release Web April 2025 (Rates Distribution, improved Legends)
      • Release Web March 2025 (Improved Zones, WorkPlans updates, Yield data enhancements)
      • Release Web January 2025 (Free Trial, Usage-based Pricing Plan, USDA Yield Cleaning protocol, Export of calibrated Yield data to John Deere Ops Center, Import of kml)
      • Release Web August 2024 (Data Layer Previews, Spatially localized Zones; Use zones and Equations in new Equations)
      • Release Web July 2024 (Equation Map creation, Spatially localized zones, Seeding and Application Work Plans)
      • Release Web May 2024 (Raw view for Satellite Images, export of Zone Maps as WorkPlan to the John Deere Operations Center, redesign of Batch Analytics)
      • Release Web April 2024 (Batch Equation Maps and enhanced layer transparency)
      • Release Web February 2024 (Per area pricing, units)
      • Release Web January 2024 (many UI improvements)
      • Release Web November 2023 (Clone Polygons, Subscription management)
      • Release Web October 2023 (Yield Calibration, Equation Maps as ISOXML, PDF Export and John Deere Integration)
      • Release Web September 2023 (Cleaning & Calibrating Yield Datasets, more languages support)
      • Release Mobile August 2023 (Mobile app impovements)
      • Release Web July 2023 (Operations Log page, Sum in datasets)
      • Release Web June 2023 (Improved Equations, Operations log v1)
      • Release Mobile May 2023 (Social Login)
      • Release Web May 2023 (John Deere integration improvements)
      • Release Web January 2023 (huge amount of small improvements)
      • Release Web October 2022 (Integration with AgGateway protocols, Isoxml support and more)
      • Release Web April 2022 (3D maps and Zoning Tools)
  • 👨‍🌾Agronomy
    • Precision Agronomy Use Cases & Best Practices Overview
    • Field Management Zones (Productivity Zones) Creation Process
    • Variable Rate Seeding (Planting) Maps
    • Yield Calibration & Cleaning
    • Synthetic Yield Map
    • Create Soil Sampling Zones, Points, Route, export as KML, and execute
    • Evaluate Accuracy of Seeding Application
    • Evaluate Accuracy of Fertilizer Application
    • Field Trial Analytics
    • Nitrogen Use Efficiency & Uptake
    • Comparing Yield Datasets
    • Compare Soil Scanner Data between Years
    • Flood Detection / Insurance report
    • Profit Maps (COMING)
    • VRA/Rx/Prescription Fertilizer Maps (COMING)
    • VRA/Rx/Prescription Nitrogen Maps (COMING)
    • VRA/Rx/Prescription Spraying Maps (COMING)
    • Multi-Layer Field Potential Maps (COMING)
    • VR Lime Application Based on Soil Scanner pH Data (COMING)
    • Merging Yield Datasets Belonging to the Same Field (COMING)
  • 📱Product Tour - Mobile App
    • Installation
    • Logging in
    • Viewing satellite images
    • Viewing zones maps
    • Viewing soil data
    • Viewing yield data
    • Viewing topography maps
    • Viewing as applied datasets
    • Working in the field/Scouting zones maps
    • Working offline
    • Filters
    • Options
    • Settings
  • 🤖API Docs
    • GeoPard API Overview
    • Getting Started
    • Authorization: ApiKey, Credentials or OAuth 2.0
    • Diagrams with Basic Flows
      • 1. Field Registration
      • 2. GraphQL Subscription
      • 3. Grep Satellite Imagery
      • 4. Upload Soil | AsApplied | Yield Datasets
      • 5. Execute Equations
      • 6. Generate ZonesMap
      • 7. Download Gridded Data
      • 8. Download Original Data
    • Data Schema
    • Requests Overview
      • 1. Subscription: Get Events
      • 2. Query: Get "Fields"
      • 3. Query: Get "SatelliteImages"
      • 4. Query: Get defined "SatelliteImage"
      • 5. Query: Get "RasterMaps"
      • 6. Query: Get "ZonesMaps"
      • 7. Mutation: Generate "ZonesMap"
      • 8. Mutation: Generate "RasterMap"
      • 9. Mutation: Generate "ZonesMap" asynchronously
      • 10. Mutation: Generate "RasterMap" asynchronously
      • 11. Mutation: Generate Yield based "ZonesMap" asynchronously
      • 12. Mutation: Generate Soil based "ZonesMap" asynchronously
      • 13. Mutation: Create "Farm"
      • 14. Mutation: Create a "Field" or edit the boundary of the existing field (with optional labels)
      • 15. Query: Get "TopographyMap"
      • 16. Query: Get "YieldDatasets"
      • 17. Query: Get "SoilDatasets"
      • 18. Mutation: Generate zip archive with "ZonesMap" and "Field"
      • 19. Mutation: Delete "Field"
      • 20. Mutation: Delete "Farm"
      • 21. Mutation: Delete "ZonesMap"
      • 22. Mutation: Delete "RasterAnalytisMap"
      • 23. Mutation: Delete "SoilDataset"
      • 24. Mutation: Delete "YieldDataset"
      • Notes (Pins)
        • 25. Mutation: Save "Note" attached to "Field"
        • 26. Mutation: Save "Note" attached to "ZonesMap"
        • 27. Mutation: Save "Note" attached to "SoilDataset"
        • 28. Mutation: Save multiple "Notes", Batch operation
        • 29. Mutation: Delete "Note"
        • 30. Mutation: Delete multiple "Notes"
        • 31. Query: Get all "Notes" related to "Field"
        • 32. Query: Get "Notes" related to "ZonesMap" and type
        • 33. Query: Get "Notes" related to "SoilDataset" and type
        • 34. Query: Get a selected "Note" with all "Comments"
        • 35. Mutation: Add "Comment" to the selected "Note"
        • 36. Mutation: Add multiple "Comments" to the selected "Notes"
      • 37. Query: Get "SatelliteImages" in the defined interval
      • 38. Query: Get "UserData"
      • 39. Mutation: Set custom color schemas to selected "GeoMaps"
      • 40. Query: Get "Labels" on the account level
      • 41. Mutation: Save "Labels" on the account level
      • 42. Mutation: Delete "Label" on the account level
      • 43. Query Get "Fields"
      • 44. Mutation: Set Field Labels
      • 45. Mutation: Save User Data
      • 46. Mutation: Generate multi-layer "ZonesMap" asynchronously
      • 47. Query: Get "ZonesMaps"
      • 48. Query: Get Gridded Data from "TopographyMap"
      • 49. Query: Get Gridded Data from "FieldSatelliteImage"
      • 50. Query: Get Gridded Data from "VectorAnalysisMap"
      • 51. Query: Get Gridded Data from "YieldDataset"
      • 52. Query: Get Gridded Data from "SoilDataset"
      • 53. Query: Get Gridded Data from "AsAppliedDataset"
      • 54. Query: Get Vector Data from "SoilDataset"
      • 55. Upload zip files (over 6 MB)
      • 56. Upload photos
      • 57. Query: Get "Photos" attached to the selected "Note"
      • 58. Query: Get "Photos" attached to "Comments"
      • 59. Query: Get "AsAppliedDatasets"
      • 60. Mutation: Generate As-Applied-based "ZonesMap" asynchronously
      • 61. Mutation: Delete "AsAppliedDataset"
      • 62. Mutation: Share Farms
      • 63. Mutation: Save Organization
      • 64. Mutation: Add Users to Organization
      • 65. Mutation: Delete Users from Organization
      • 66. Mutation: Save Field
      • 67. Mutation: Save Farm
      • 68. Mutation: Refresh "VectorAnalysisMap" Statistics
      • 69. Mutation: Delete "Photo"
      • 70. Mutation: Delete multiple "Photos"
      • 71. Mutation: Generate a zip archive with "Notes"
      • 72. Query: Get Gridded Data as GeoJSON or GeoTIFF
      • 73. Query: Get Gridded Data with the Selected Buffer
      • 74. Mutation: Verify "Equation"
      • 75. Mutation: Generate "EquationMap" asynchronously
      • 76. Query: Get "EquationMap"
      • 77. Mutation: Delete "EquationMap"
      • 78. Query: Find "Fields" by "externalKey"
      • 79. Query: Find "Farms" by "externalKey"
      • 80. Query: Get Original Data
      • 81. Query: Get GeoJSON of "EquationMap"
      • 82. Query: Restore Subscription Events
      • 83. Query: Collect Platform Context
      • 84. Mutation: Calibrate and Clean YieldDataset
      • 85. Mutation: Assign Rates to VectorAnalysisMap (ZonesMap)
      • 86. Query: Get "Farms"
      • 87. Mutation: Save Custom VectorAnalysisMap (ZonesMap)
      • 88. Mutation: Export ZonesMap as Zipped Shapefile
      • 89. Mutation: Export ZonesMap as Zipped ISOXML
    • Geo Endpoints
      • WMS - Get Raster Pictures of Spatial Data Layers
        • 1. LAI
        • 2. RGB
        • 3. Field: boundary
        • 4. Field: thumbnail
        • 5. ZonesMap
        • 6. ZonesMap: custom color schema
        • 7. ZonesMap: thumbnail
        • 8. RasterMap
        • 9. RasterMap: custom color schema
        • 10. RasterMap: thumbnail
        • 11. TopographyMap: elevation in absolute numbers
        • 12. YieldDatasetsMap
        • 13. SoilDatasetsMap
        • 14. SoilDatasetsMap: custom color schema
        • 15. AsAppliedDatasetsMap
        • 16. Satellite Image: cropped by Field boundary
        • 17. Satellite Image: cropped by Field boundary and custom color schema
        • 18. YieldDatasetsMap: custom color schema
        • 19. Satellite Image: 10 colors visualization
      • WFS - Get Spatial Data Layers in Vector format (shp, geojson)
        • 1. Get the Field Boundary as Geojson
        • 2. Get the Zones map as Geojson
        • 3. Get Zones Attributes as JSON
        • 4. Get Soil data as Geojson
        • 5. Get Yield data as Geojson
    • Uploading Files
    • API FAQ
  • 🛣️Platform Roadmap
    • Roadmap
  • GIS quick Hints
    • QGIS: Change String to Number values in the shapefile
    • QGIS: Yield Data Manipulations
    • QGIS: Split Boundaries Into Subfields
    • QGIS: Merge Vector Layers
    • QGIS: Merge Selected Features from Vector Files
    • QGIS: Calculate NDVI for the Drone Geotiff File
    • QGIS: Split Multi-field Shapefiles
    • QGIS: Convert CSV to SHP
    • QGIS: Reproject Shapefile
  • Policies
    • Your Data Stays Yours, Securely Managed By GeoPard
    • Terms & Conditions
    • Privacy Policy
Powered by GitBook

Start Working with GeoPard

  • Go to GeoPard Website
  • Demo Request
  • LinkedIn

This Portal Sections

  • Introduction
  • Product Tour - Web App (incl. video)
  • Product Tour - Mobile App (incl. video)
  • Precision Agronomy Use Cases

Powered by GeoPard Agriculture - Automated precisionAg platform

On this page
  • 1. Natural Breaks Classification
  • 2. Equal Interval Classification
  • 3. Equal Count (Area) Classification
  • 4. Spatially Localized Classification
  • 4.1. Balanced Option of Spatially Localized
  • 4.2. Towards Values of Spatially Localized
  • 4.3. Towards Spatial of Spatially Localized

Was this helpful?

  1. Product Tour - Web App
  2. Zones Maps and Analytics

Usage of Data Classification

PreviousDraw Zones Manually, Clone from an existing layerNextEdit Zones Map: Merge & Split

Last updated 7 months ago

Was this helpful?

Data classification is a crucial step in the analysis and visualization of geographic data. GeoPard offers several classification methods to help users effectively understand and interpret their data. Three commonly used data classification types in GeoPard are Natural Breaks, Equal Interval, and Equal Count (Area). Each classification method has its unique characteristics and application scenarios, as described below:

1. Natural Breaks Classification

The Natural Breaks classification identifies "natural" thresholds or breakpoints in the data distribution to create distinct groups. It maximizes differences between classes and minimizes differences within each class. Natural Breaks is useful for data with clear patterns or clusters, allowing effective exploration and analysis.

2. Equal Interval Classification

The Equal Interval classification divides the data range into equal intervals or bins. It provides a balanced representation of data distribution, making it easy to interpret and compare values within each interval. Equal Interval is suitable for evenly distributed data without distinct patterns.

3. Equal Count (Area) Classification

The Equal Count classification ensures an equal number of data values in each class. It maintains a balanced representation, especially for skewed or unevenly distributed data. Equal Count enables fair comparisons between areas or regions, providing consistent analysis and visualization.

4. Spatially Localized Classification

The Spatially Localized classification clusters data geospatially, creating localized zones. Its primary use case is planning Zones for Soil Sampling, enabling efficient segmentation of Fields into manageable areas.

To offer greater flexibility, the Spatial Localized classification includes three distinct options: towards Spatial, towards Values, and Balanced, allowing you to customize the clustering process based on specific needs.

4.1. Balanced Option of Spatially Localized

The Balanced option of Spatially Localized Classification provides a middle ground between the toward Spatial and towards Values options. It creates a ZonesMap with clusters that achieve a balance between geographic proximity and data value similarity. This approach is useful when both spatial compactness and data consistency are important, offering a well-rounded solution for most general use cases.

4.2. Towards Values of Spatially Localized

Towards Values option of Spatially Localized Classfication, in contrast, produces zones that are clustered based on data values rather than geographic proximity. This option groups areas with similar data attributes, such as vegetation or soil quality, to create a ZonesMap where the primary focus is on data consistency within each zone. This is best suited for use cases where the uniformity of the data within zones is more critical than their spatial arrangement.

4.3. Towards Spatial of Spatially Localized

Towards Spatial option of Spatially Localized Classification focuses on creating zones that are more geographically concentrated. This produces a ZonesMap with clusters that prioritize proximity, ensuring that each zone is spatially compact. It is ideal for applications where the physical location of the zones is the primary concern, such as logistics or spatial-based sampling.

The goal is to create zones with relatively similar area sizes, but rounding operations and zone quality enhancements may introduce slight variations. Therefore, using vegetation indexes with higher granularity, such as EVI2, MCARI1, or WDRVI, results in more precise outcomes. And .

🖥️
📊
the final geometries of the zones are fine-tuned to improve accuracy
Natural Breaks Classification
Equal Interval Classificaiton
Equal Count (Area) Classification
Spatially Localized Classification (Balanced Option)
Spatially Localized Classification (towards Values Option)
Spatially Localized Classification (towards Spatial Option)