
Batch Equation-Based Analytics: equation selection
Batch Equation-Based Analytics: equation selection

Batch calculation of Nitrogen removal based on Yield and Moisture data. Includes the calculation of an average per ha and total amount of product

Layer Transparency Controls: field page
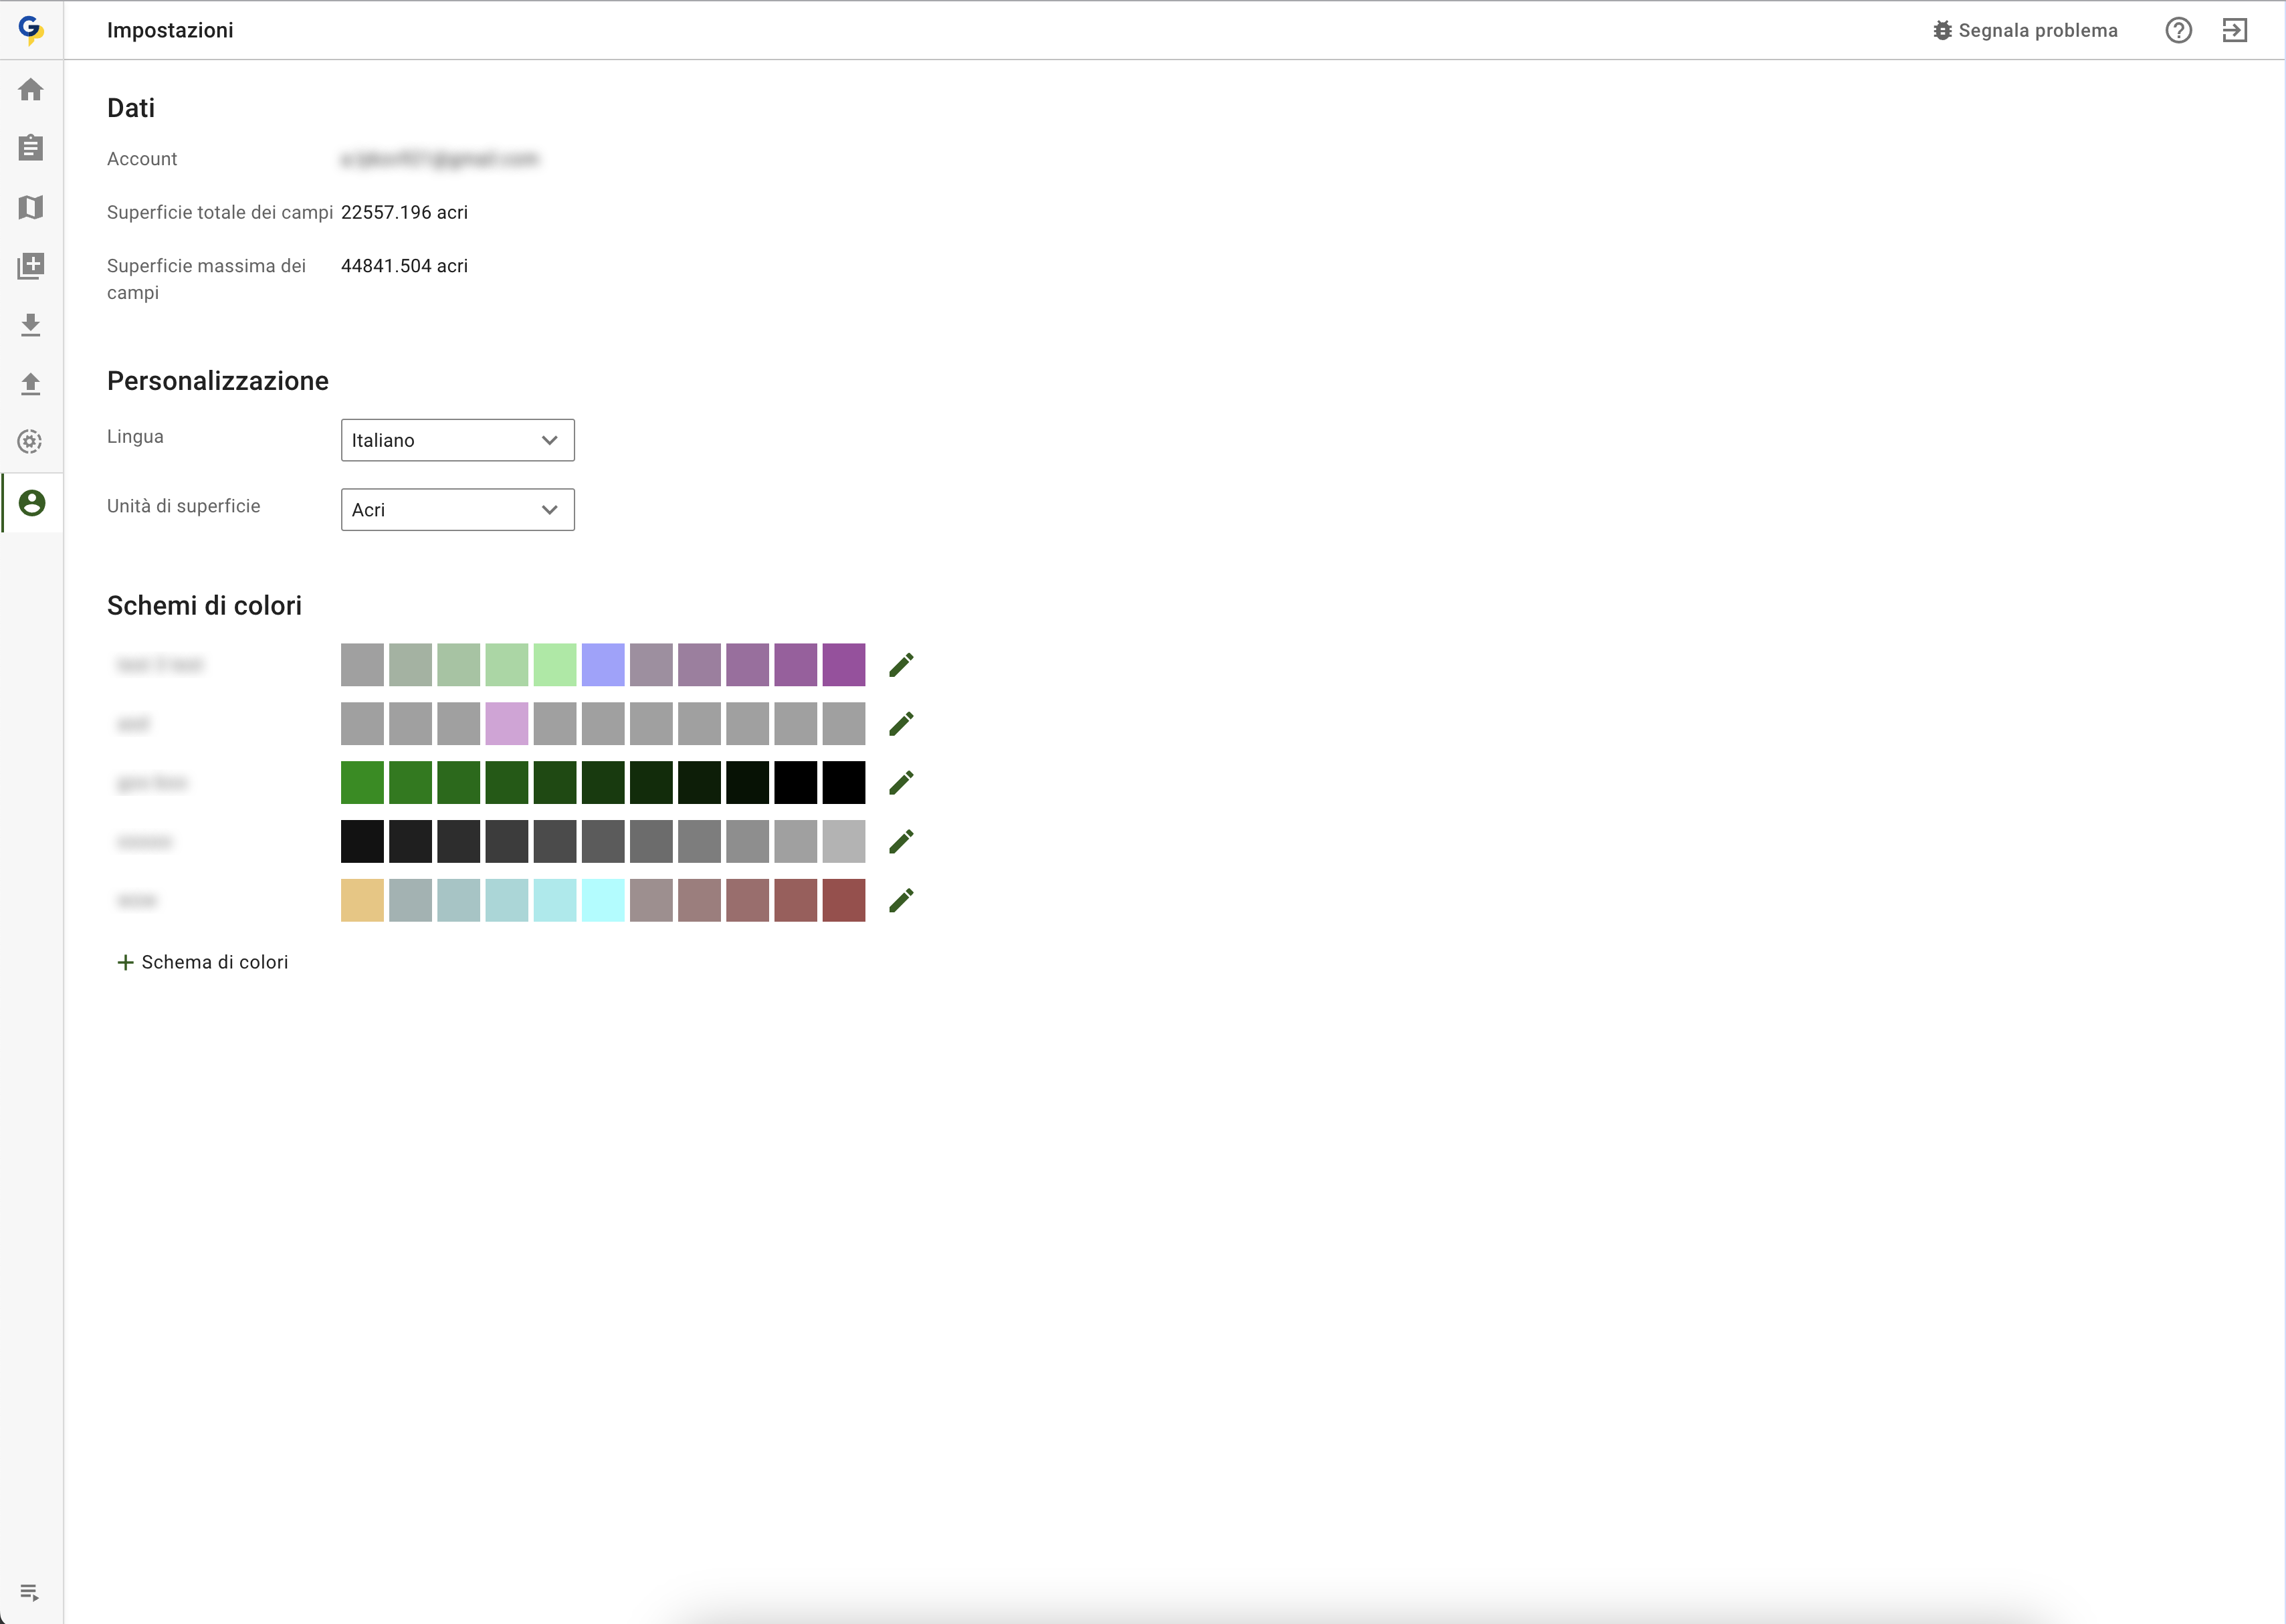
Italian Language Support

Enhanced Layer Comparison

Improved Navigation on Operations Log Page

Streamlined Subscription Management for non-Stripe Users
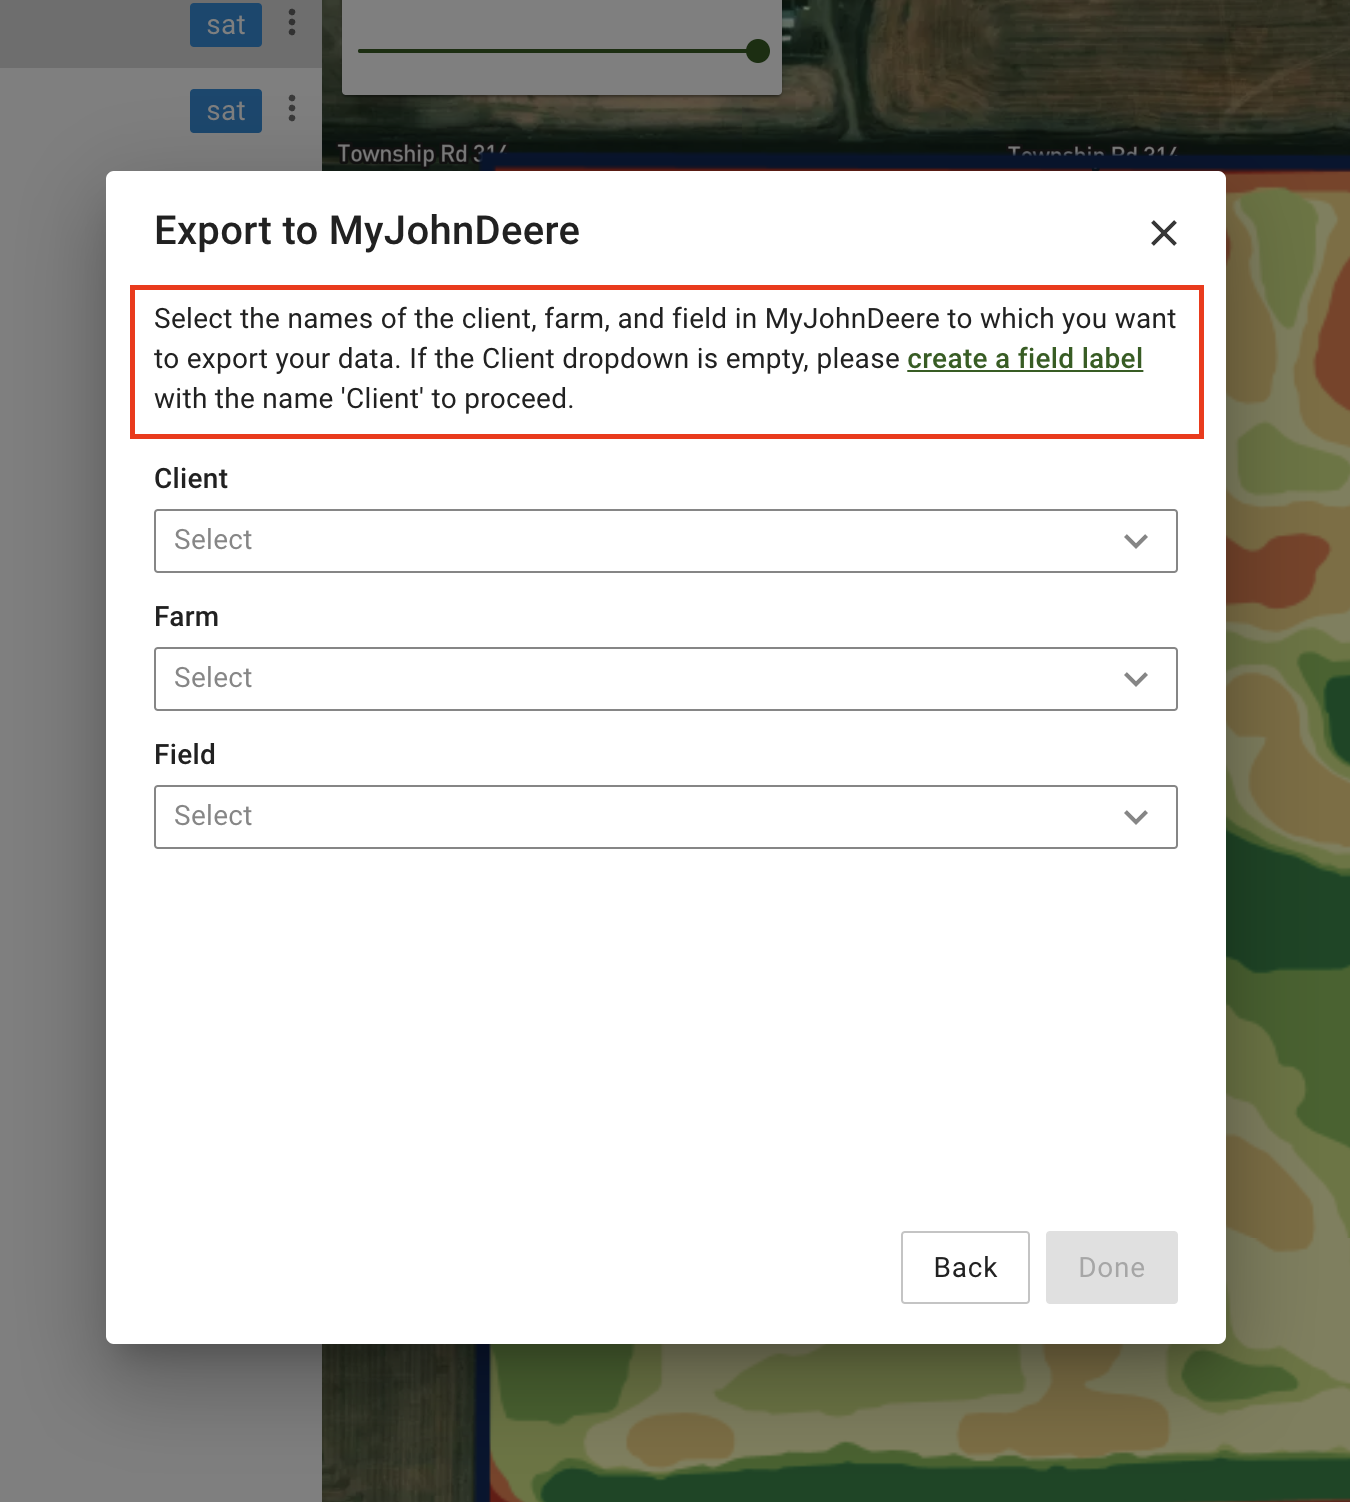
Guidance Update for Export to MyJohnDeere

Flexible Subscription Payments with Stripe

Flexible Subscription Payments with Stripe

Improved Notification Handling for PDF Report Creation