> For the complete documentation index, see [llms.txt](https://docs.geopard.tech/geopard-tutorials/llms.txt). Markdown versions of documentation pages are available by appending `.md` to page URLs; this page is available as [Markdown](https://docs.geopard.tech/geopard-tutorials/product-tour-web-app/zones-maps-and-analytics/relative-variation-factor.md).
# Relative variation factor
Detecting changes that happened in the field during the last one-two weeks or one-two months or even a couple of years helps to get insights into crop development.
Relative variation factor or Relative Variation Index can be used to:
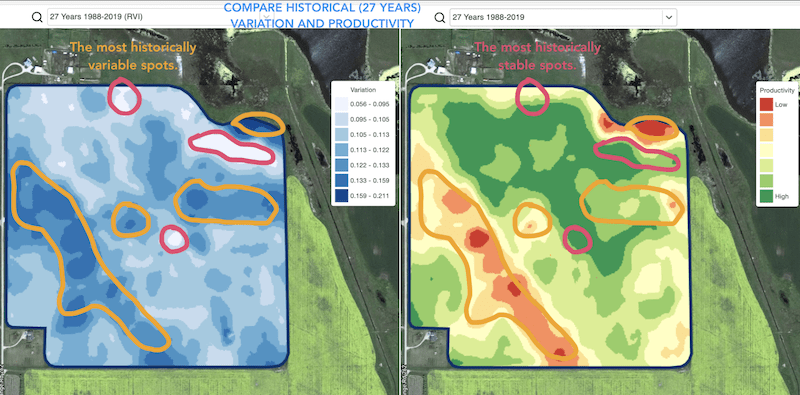
* locate spots with similar performance across 5-10-20 years and place the trials in areas with similar conditions to reduce the probability of mistake
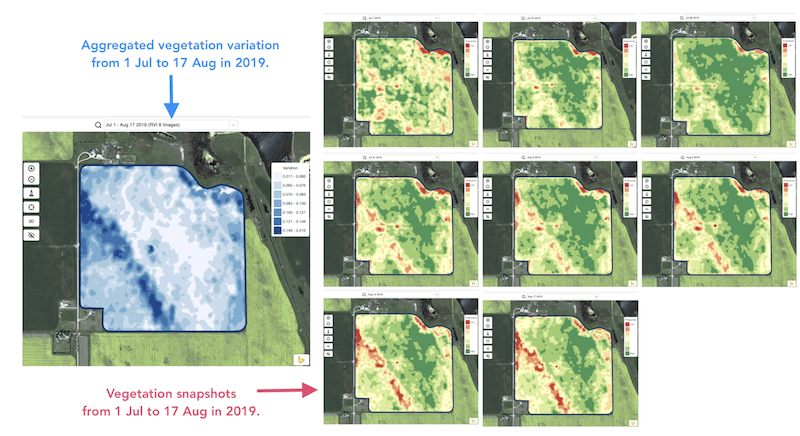
* track the changes during the season and evaluate crop performance during the growth
* recognize the damaged areas after a weather disaster or a disease or a pest attack and calculate damaged areas
* detect the difference between the last two images and control the crop performance.
GeoPard’s Relative Variation Index (RVI) covers all those cases and many others. RVI will provide more insights into crop development when used together in combination with in-season and historical management zones.
Simply choose your field and satellite images to track the changes across them and get insights about every spot in your field.
---
# Agent Instructions
This documentation is published with GitBook. GitBook is the documentation platform designed so that both humans and AI agents can read, navigate, and reason over technical content effectively. Learn more at gitbook.com.
## Querying This Documentation
If you need additional information that is not directly available in this page, you can query the documentation dynamically by asking a question.
Perform an HTTP GET request on the current page URL with the `ask` query parameter:
```
GET https://docs.geopard.tech/geopard-tutorials/product-tour-web-app/zones-maps-and-analytics/relative-variation-factor.md?ask=
```
The question should be specific, self-contained, and written in natural language.
The response will contain a direct answer to the question and relevant excerpts and sources from the documentation.
Use this mechanism when the answer is not explicitly present in the current page, you need clarification or additional context, or you want to retrieve related documentation sections.