# Creating Zones Map using a Template
Using a Zones map template can be useful when you want to create a new map using pre-selected data and settings of existing Zones map by adding new, fresh data. For example, you have a 3-year satellite zones map and you want to add a new image (from the current year) for the analysis and have pre-selected the same number of zones and vegetation index that were used for your existing template Zones map.
The process is the same as when creating a new Zones map, but now you use an already existing Zones map as the starting point.
1. Select the field in the tree, click the **Create Zones Map** button, select **Clone an existing Zones Map,** and then **Next**.
2. In the next step, select the zones map you want to use as the template. Click **Next**.
3. The same criteria are applied with the same index. You see pre-selected images used in template analysis. Here you can select an image (images) you want to add or replace.
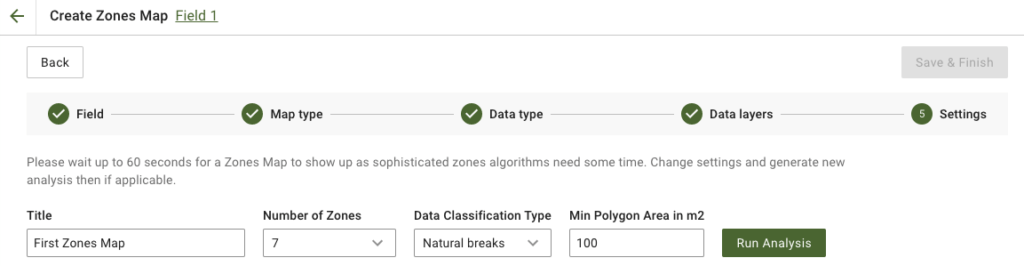
4. In the next step, you can edit the title, change the number of zones, [select a Data Classification Type](https://docs.geopard.tech/geopard-tutorials/product-tour-web-app/zones-maps-and-analytics/usage-of-data-classification), and define Minimum Polygon Area in square meters. Click **Run Analysis** to proceed.
The analysis may run for up to 60 seconds, depending on the parameters you have specified.
5. Once it is finished, click **Save & Finish**.
After it is saved you will see the following message:
You can either create another zones map, assign the rates or go to the Zones map you have just created.