GeoPard Tutorials | Precision Ag Software
  • Introduction to GeoPard
    • GeoPard Platform: Frequently Asked Questions (FAQ)
  • 🖥️Product Tour - Web App
    • Getting Started
      • Create a new farm
      • Draw a new field
      • Upload a field boundary
      • Edit a boundary
      • Edit a field name
      • Add a label
    • 🛰️Satellite Monitoring
      • Order Planet Scope (3m daily) imagery
      • Indices for Crops and Soils
      • 📈Crop Development Index Graph
    • 📊Zones Maps and Analytics
      • Assign Variable Rates in the Zones (Ag inputs Rates Distribution Tool)
      • Creating Zones Map using Satellite Imagery
      • Creating Zones Map using Soil/Yield/As Applied Data
      • Creating Zones Map using Topography
      • Creating Zones Map using a Template
      • Draw Zones Manually, Clone from an existing layer
      • Usage of Data Classification
      • Edit Zones Map: Merge & Split
      • Multi-Year Zones
      • Multi-Layer Analytics
      • Compare layers
      • Heterogeneity factor
      • Relative variation factor
    • 📊Equation-based Analytics
      • Batch Equation analytics
      • Catalog of Predefined Agronomic Equations
      • Catalog of Custom Functions
    • ⛰️Topography
    • ⛰️3D Maps
    • Import
      • Field Boundary
      • Soil Data
      • Yield Data
      • As Applied/As Planted Data
      • Machinery Proprietary Formats
      • Import from MyJohnDeere
    • Export / Download
      • Field Boundary Export
      • Batch Export of Boundaries, Zones and Scouting Pins
      • Zones Map Export as shapefile
      • Satellite Imagery Export as geotiff or geojson
      • Export Scouting Notes as shapefile
      • Export VRA map In ISOXML Format
      • Export to MyJohnDeere
    • 🤖API
    • Operations Log - Track errors/Imports and Analytics
    • Organizations and Roles
    • Farms Sharing between Accounts & Organizations
    • Managing Crop Season information with tags(labels)
      • Case: Managing fields for several clients
      • Case: Season details including crop and year
      • Case: Field operation details
    • ⚙️User Settings
      • Subscriptions, Account limits & Plans
      • Restoring password
      • Order the package
      • Changing preferences
    • 🚜John Deere Operations Center Integration
      • 🚜John Deere Operations Center Integration
        • 1. Create Free Trial Account with you John Deere Account
        • 2. Connect to JohnDeere Operations Center
        • 3. Connect to John Deere Organizations
        • 4. Import into GeoPard from John Deere Operations Center
        • 5. Configure Automated Data Sync
        • 6. Export Rx Maps to John Deere Operations Center as Files
        • 7. Export Field Boundaries into John Deere Operations Center
          • 7a. Organization configuration of export boundary to John Deere Operations Center as File
        • 8. Export Rx Maps to John Deere Operations Center as Work Plans
        • 9. Export Soil, Topography, Satellite or Analytics as Map Layers
      • 🚜John Deere Operations Center Data Sharing
        • 1. "Staff Member" sharing
        • 2. Problem-solving of "Staff Member" sharing
        • 3. "Partner Organization" sharing
        • 4. Problem-solving of "Partner Organization" sharing
        • 5. Problem-solving of import from John Deere to GeoPard
        • 6. Problem-solving of Work Plan creation
        • 7. Sharing Fields/Boundaries Between Partner Organizations in John Deere Ops Center, DataSync config
  • 🚀Changelog & Product Releases
    • Release Notes
      • Release Web April 2025 (Rates Distribution, improved Legends)
      • Release Web March 2025 (Improved Zones, WorkPlans updates, Yield data enhancements)
      • Release Web January 2025 (Free Trial, Usage-based Pricing Plan, USDA Yield Cleaning protocol, Export of calibrated Yield data to John Deere Ops Center, Import of kml)
      • Release Web August 2024 (Data Layer Previews, Spatially localized Zones; Use zones and Equations in new Equations)
      • Release Web July 2024 (Equation Map creation, Spatially localized zones, Seeding and Application Work Plans)
      • Release Web May 2024 (Raw view for Satellite Images, export of Zone Maps as WorkPlan to the John Deere Operations Center, redesign of Batch Analytics)
      • Release Web April 2024 (Batch Equation Maps and enhanced layer transparency)
      • Release Web February 2024 (Per area pricing, units)
      • Release Web January 2024 (many UI improvements)
      • Release Web November 2023 (Clone Polygons, Subscription management)
      • Release Web October 2023 (Yield Calibration, Equation Maps as ISOXML, PDF Export and John Deere Integration)
      • Release Web September 2023 (Cleaning & Calibrating Yield Datasets, more languages support)
      • Release Mobile August 2023 (Mobile app impovements)
      • Release Web July 2023 (Operations Log page, Sum in datasets)
      • Release Web June 2023 (Improved Equations, Operations log v1)
      • Release Mobile May 2023 (Social Login)
      • Release Web May 2023 (John Deere integration improvements)
      • Release Web January 2023 (huge amount of small improvements)
      • Release Web October 2022 (Integration with AgGateway protocols, Isoxml support and more)
      • Release Web April 2022 (3D maps and Zoning Tools)
  • 👨‍🌾Agronomy
    • Precision Agronomy Use Cases & Best Practices Overview
    • Field Management Zones (Productivity Zones) Creation Process
    • Variable Rate Seeding (Planting) Maps
    • Yield Calibration & Cleaning
    • Synthetic Yield Map
    • Create Soil Sampling Zones, Points, Route, export as KML, and execute
    • Evaluate Accuracy of Seeding Application
    • Evaluate Accuracy of Fertilizer Application
    • Field Trial Analytics
    • Nitrogen Use Efficiency & Uptake
    • Comparing Yield Datasets
    • Compare Soil Scanner Data between Years
    • Flood Detection / Insurance report
    • Profit Maps (COMING)
    • VRA/Rx/Prescription Fertilizer Maps (COMING)
    • VRA/Rx/Prescription Nitrogen Maps (COMING)
    • VRA/Rx/Prescription Spraying Maps (COMING)
    • Multi-Layer Field Potential Maps (COMING)
    • VR Lime Application Based on Soil Scanner pH Data (COMING)
    • Merging Yield Datasets Belonging to the Same Field (COMING)
  • 📱Product Tour - Mobile App
    • Installation
    • Logging in
    • Viewing satellite images
    • Viewing zones maps
    • Viewing soil data
    • Viewing yield data
    • Viewing topography maps
    • Viewing as applied datasets
    • Working in the field/Scouting zones maps
    • Working offline
    • Filters
    • Options
    • Settings
  • 🤖API Docs
    • GeoPard API Overview
    • Getting Started
    • Authorization: ApiKey, Credentials or OAuth 2.0
    • Diagrams with Basic Flows
      • 1. Field Registration
      • 2. GraphQL Subscription
      • 3. Grep Satellite Imagery
      • 4. Upload Soil | AsApplied | Yield Datasets
      • 5. Execute Equations
      • 6. Generate ZonesMap
      • 7. Download Gridded Data
      • 8. Download Original Data
    • Data Schema
    • Requests Overview
      • 1. Subscription: Get Events
      • 2. Query: Get "Fields"
      • 3. Query: Get "SatelliteImages"
      • 4. Query: Get defined "SatelliteImage"
      • 5. Query: Get "RasterMaps"
      • 6. Query: Get "ZonesMaps"
      • 7. Mutation: Generate "ZonesMap"
      • 8. Mutation: Generate "RasterMap"
      • 9. Mutation: Generate "ZonesMap" asynchronously
      • 10. Mutation: Generate "RasterMap" asynchronously
      • 11. Mutation: Generate Yield based "ZonesMap" asynchronously
      • 12. Mutation: Generate Soil based "ZonesMap" asynchronously
      • 13. Mutation: Create "Farm"
      • 14. Mutation: Create a "Field" or edit the boundary of the existing field (with optional labels)
      • 15. Query: Get "TopographyMap"
      • 16. Query: Get "YieldDatasets"
      • 17. Query: Get "SoilDatasets"
      • 18. Mutation: Generate zip archive with "ZonesMap" and "Field"
      • 19. Mutation: Delete "Field"
      • 20. Mutation: Delete "Farm"
      • 21. Mutation: Delete "ZonesMap"
      • 22. Mutation: Delete "RasterAnalytisMap"
      • 23. Mutation: Delete "SoilDataset"
      • 24. Mutation: Delete "YieldDataset"
      • Notes (Pins)
        • 25. Mutation: Save "Note" attached to "Field"
        • 26. Mutation: Save "Note" attached to "ZonesMap"
        • 27. Mutation: Save "Note" attached to "SoilDataset"
        • 28. Mutation: Save multiple "Notes", Batch operation
        • 29. Mutation: Delete "Note"
        • 30. Mutation: Delete multiple "Notes"
        • 31. Query: Get all "Notes" related to "Field"
        • 32. Query: Get "Notes" related to "ZonesMap" and type
        • 33. Query: Get "Notes" related to "SoilDataset" and type
        • 34. Query: Get a selected "Note" with all "Comments"
        • 35. Mutation: Add "Comment" to the selected "Note"
        • 36. Mutation: Add multiple "Comments" to the selected "Notes"
      • 37. Query: Get "SatelliteImages" in the defined interval
      • 38. Query: Get "UserData"
      • 39. Mutation: Set custom color schemas to selected "GeoMaps"
      • 40. Query: Get "Labels" on the account level
      • 41. Mutation: Save "Labels" on the account level
      • 42. Mutation: Delete "Label" on the account level
      • 43. Query Get "Fields"
      • 44. Mutation: Set Field Labels
      • 45. Mutation: Save User Data
      • 46. Mutation: Generate multi-layer "ZonesMap" asynchronously
      • 47. Query: Get "ZonesMaps"
      • 48. Query: Get Gridded Data from "TopographyMap"
      • 49. Query: Get Gridded Data from "FieldSatelliteImage"
      • 50. Query: Get Gridded Data from "VectorAnalysisMap"
      • 51. Query: Get Gridded Data from "YieldDataset"
      • 52. Query: Get Gridded Data from "SoilDataset"
      • 53. Query: Get Gridded Data from "AsAppliedDataset"
      • 54. Query: Get Vector Data from "SoilDataset"
      • 55. Upload zip files (over 6 MB)
      • 56. Upload photos
      • 57. Query: Get "Photos" attached to the selected "Note"
      • 58. Query: Get "Photos" attached to "Comments"
      • 59. Query: Get "AsAppliedDatasets"
      • 60. Mutation: Generate As-Applied-based "ZonesMap" asynchronously
      • 61. Mutation: Delete "AsAppliedDataset"
      • 62. Mutation: Share Farms
      • 63. Mutation: Save Organization
      • 64. Mutation: Add Users to Organization
      • 65. Mutation: Delete Users from Organization
      • 66. Mutation: Save Field
      • 67. Mutation: Save Farm
      • 68. Mutation: Refresh "VectorAnalysisMap" Statistics
      • 69. Mutation: Delete "Photo"
      • 70. Mutation: Delete multiple "Photos"
      • 71. Mutation: Generate a zip archive with "Notes"
      • 72. Query: Get Gridded Data as GeoJSON or GeoTIFF
      • 73. Query: Get Gridded Data with the Selected Buffer
      • 74. Mutation: Verify "Equation"
      • 75. Mutation: Generate "EquationMap" asynchronously
      • 76. Query: Get "EquationMap"
      • 77. Mutation: Delete "EquationMap"
      • 78. Query: Find "Fields" by "externalKey"
      • 79. Query: Find "Farms" by "externalKey"
      • 80. Query: Get Original Data
      • 81. Query: Get GeoJSON of "EquationMap"
      • 82. Query: Restore Subscription Events
      • 83. Query: Collect Platform Context
      • 84. Mutation: Calibrate and Clean YieldDataset
      • 85. Mutation: Assign Rates to VectorAnalysisMap (ZonesMap)
      • 86. Query: Get "Farms"
      • 87. Mutation: Save Custom VectorAnalysisMap (ZonesMap)
      • 88. Mutation: Export ZonesMap as Zipped Shapefile
      • 89. Mutation: Export ZonesMap as Zipped ISOXML
    • Geo Endpoints
      • WMS - Get Raster Pictures of Spatial Data Layers
        • 1. LAI
        • 2. RGB
        • 3. Field: boundary
        • 4. Field: thumbnail
        • 5. ZonesMap
        • 6. ZonesMap: custom color schema
        • 7. ZonesMap: thumbnail
        • 8. RasterMap
        • 9. RasterMap: custom color schema
        • 10. RasterMap: thumbnail
        • 11. TopographyMap: elevation in absolute numbers
        • 12. YieldDatasetsMap
        • 13. SoilDatasetsMap
        • 14. SoilDatasetsMap: custom color schema
        • 15. AsAppliedDatasetsMap
        • 16. Satellite Image: cropped by Field boundary
        • 17. Satellite Image: cropped by Field boundary and custom color schema
        • 18. YieldDatasetsMap: custom color schema
        • 19. Satellite Image: 10 colors visualization
      • WFS - Get Spatial Data Layers in Vector format (shp, geojson)
        • 1. Get the Field Boundary as Geojson
        • 2. Get the Zones map as Geojson
        • 3. Get Zones Attributes as JSON
        • 4. Get Soil data as Geojson
        • 5. Get Yield data as Geojson
    • Uploading Files
    • API FAQ
  • 🛣️Platform Roadmap
    • Roadmap
  • GIS quick Hints
    • QGIS: Change String to Number values in the shapefile
    • QGIS: Yield Data Manipulations
    • QGIS: Split Boundaries Into Subfields
    • QGIS: Merge Vector Layers
    • QGIS: Merge Selected Features from Vector Files
    • QGIS: Calculate NDVI for the Drone Geotiff File
    • QGIS: Split Multi-field Shapefiles
    • QGIS: Convert CSV to SHP
    • QGIS: Reproject Shapefile
  • Policies
    • Your Data Stays Yours, Securely Managed By GeoPard
    • Terms & Conditions
    • Privacy Policy
Powered by GitBook

Start Working with GeoPard

  • Go to GeoPard Website
  • Demo Request
  • LinkedIn

This Portal Sections

  • Introduction
  • Product Tour - Web App (incl. video)
  • Product Tour - Mobile App (incl. video)
  • Precision Agronomy Use Cases

Powered by GeoPard Agriculture - Automated precisionAg platform

On this page
  • Original YieldDataset with WetMass attribute
  • Calibrated and Cleaned YieldDataset with WetMass attribute
  • Pathwise vs Average/Total vs Conditional options
  • Hints
  • Documentation: Mutation details
  • Documentation: YieldDataset query

Was this helpful?

  1. API Docs
  2. Requests Overview

84. Mutation: Calibrate and Clean YieldDataset

API calls to clean and calibrate Yield datasets

Previous83. Query: Collect Platform ContextNext85. Mutation: Assign Rates to VectorAnalysisMap (ZonesMap)

Last updated 10 months ago

Was this helpful?

Calibrating the "YieldDataset" is a functionality that corrects the distribution of values in alignment with mathematical principles, enhancing the overall integrity of the data. It bolsters the quality of decision-making and renders the dataset valuable for further in-depth analysis.

Common use cases for this functionality include:

  • Synchronizing data when multiple harvesters have worked either simultaneously or over several days, ensuring consistency.

  • Making the dataset more homogeneous and accurate by smoothing out variations.

  • Removing data noise and extraneous information that can cloud insights.

  • Eliminating turnarounds or abnormal geometries, which may distort the actual patterns and trends in the field.

  • Adjusting yield data to correspond with established averages or totals for each attribute.

For a more detailed exploration and examples, please refer to our use case.

Original YieldDataset with WetMass attribute

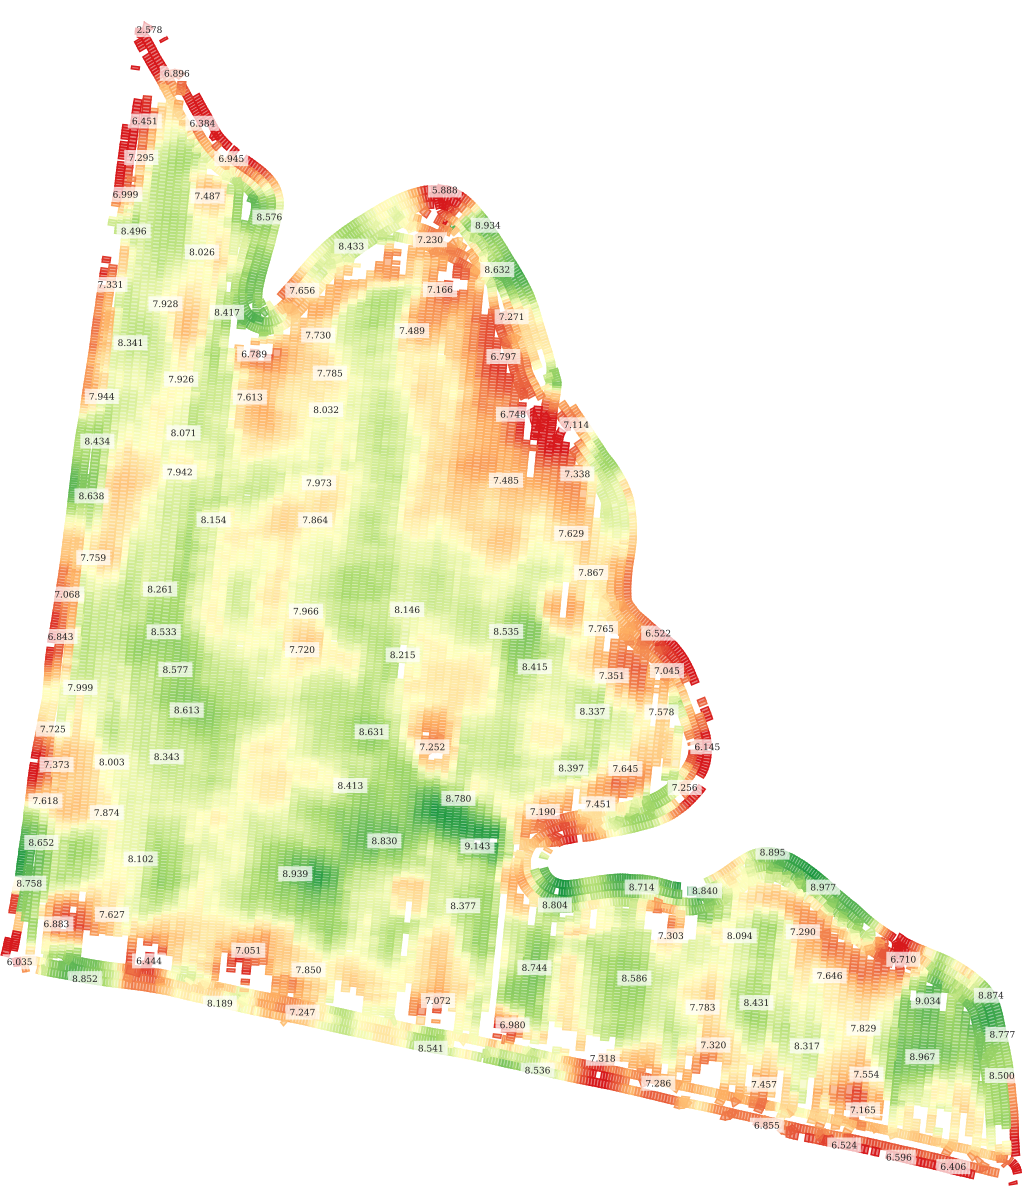
Five harvesters worked in parallel on the 30ha Field shown below. The calibration of one of the harvesters was not synchronized with the others, resulting in orange spots, indicating that additional CALIBRATION is required. Additionally, there are numerous turn-around red spots closer to the "Field" edges that need to be eliminated.

Calibrated and Cleaned YieldDataset with WetMass attribute

The result below shows the dataset after applying automatic CALIBRATE and CLEAN operations using default parameters. The resulting "YieldDataset" has become homogeneous, without outliers or abrupt changes between neighboring geometries.

Pathwise vs Average/Total vs Conditional options

Pathwise calibration corresponds to the machine's tracks. Each machine track is processed as an individual region for calibration purposes. The GeoPard team suggests using this method as the standard approach.

Average/Total calibration focuses on redistributing attribute values. If the geospatial patterns are accurate but the absolute figures deviate from the actuals, this method proves beneficial. For optimal results, GeoPard advises combining it with Pathwise calibration: first applying Pathwise, then adjusting to known Average/Total values.

Conditional calibration adjusts attribute values based on provided min and max thresholds. This method is especially valuable when the geospatial patterns are precise, but the distribution of values requires adjustments, particularly when known min and max values exist. For the best outcomes, GeoPard recommends pairing it with Pathwise calibration: starting with Pathwise, followed by adjustments to align with the known min and max values.

Hints

Hint for Data Anomalies

If a user encounters anomalies in the data, such as values at or near zero, or unusually large values (for instance, an average of 10 with a maximum of 8000), the Clean & Calibration workflow is advised. It is configured using parameters actions: [CLEAN, CALIBRATE].

Prioritizing data Cleaning before Calibration ensures the removal of errors, missing values, or inconsistencies, thereby enhancing data quality and accuracy.

Hint for Data without Initial Errors

For datasets initially free from errors, missing values, or inconsistencies, and when multiple harvesters are known to be involved, consider the Calibration & Clean workflow. It is configured using parameters actions: [CALIBRATE, CLEAN].

Cleaning the data post-calibration helps to refine the dataset further by potentially eliminating any artifacts introduced during calibration.

Documentation: Mutation details

The default standard configuration enables auto calibration and cleansing of the "YieldDataset".

mutation AutoCalibrateYieldDataset {
  calibrateYieldDataset(input: {
    fieldUuid: "<placeholder_of_field_uuid>"
    yieldDatasetUuid: "<placeholder_of_dataset_uuid>"
    actions: {
      calibrateAction: {
        calibrationAttributes:["WetMass", "VRYIELDVOL"]
        conditionPathwiseCalibration: {
          calibrationBasis: "WetMass"
          maxHomogeneityRegion: true
          syntheticMachinePath: true
        }
      }
      cleanAction: {
        condtionAutoClean: {
          targetAttribute: "WetMass"
        }
      }
      
      actions:  [CALIBRATE, CLEAN]
    }
  }) {
    uuid
    fieldUuid
    originalUuid
    statusCode
    statusMessage
  }
}

A more advanced sample provides manual control of min/max ranges and incorporates additional attributes.

mutation CustomCalibrateYieldDataset {
  calibrateYieldDataset(input: {
    fieldUuid: "<placeholder_of_field_uuid>"
    yieldDatasetUuid: "<placeholder_of_dataset_uuid>"
    actions: {
      calibrateAction: {
        calibrationAttributes:["WetMass", "VRYIELDVOL"]
        smoothWindowSize: 11
        conditionPathwiseCalibration: {
          calibrationBasis: "Machine"
          maxHomogeneityRegion: true
          syntheticMachinePath: false
        }
        conditionAvgTotalCalibration:[{
          calibrationAttribute: "WetMass"
          average:8.0
        }]
      }
      cleanAction: {
        condtionAutoClean: {
          targetAttribute: "WetMass"
        }
        conditionMinMaxClean: [{
          cleanAttribute: "Distance"
          min: 1.5
          max: 10.0
        }]
      }
      actions:  [CALIBRATE, CLEAN]
    }
  }) {
    uuid
    fieldUuid
    originalUuid
    statusCode
    statusMessage
  }
}

To follow the USDA protocol for the CLEAN operation, you must either mention ALL columns in the cleanAction -> conditionMinMaxClean or specify a portion of them in cleanAction -> conditionMinMaxClean and the remaining ones in condtionAutoClean -> excludedAttributes.

Input parameters:

  • actions as an array, allowing you to choose the correcting actions and their sequence of application; supported values include CLEAN and CALIBRATE.

  • calibrateAction as an object containing configuration details related to the CALIBRATE operation.

    • calibrationAttributes as an array of attributes requiring calibration, typically linked to the Yield column.

    • smoothWindowSize as an odd integer that smoothens the result values, reducing abrupt jumps in the values.

    • conditionPathwiseCalibration as an object with the Pathwise calibration corresponds to the machine's tracks. Each machine track is processed as an individual region for calibration purposes.

      • calibrationBasis as a string representing the attribute used as the basis for calibration.

      • maxHomogeneityRegion as a boolean that indicates whether the maximum homogeneity region is used as the referenced region for calibration.

      • syntheticMachinePath as a boolean that indicates the simulation of machine routes, it is beneficial when the precise machine path attribute is absent and needs simulation based on timestamps or a similar attribute.

    • conditionAvgTotalCalibration as an object with the Average/Total calibration focuses on redistributing attribute values. If the geospatial patterns are accurate but the absolute figures deviate from the actuals, this method proves beneficial.

      • calibrationAttribute as a string representing the attribute used to be calibrated.

      • average as a number representing the average values of the attribute; the attribute values should align with this average. Only one option, either average or total, should be utilized at a time.

      • total as a number representing the total sum of the attribute values; the aggregate of these values should match the total. Only one option, either average or total, should be utilized at a time.

    • conditionMinMaxCalibration as an object with the Conditional calibration adjusts attribute values based on provided min and max thresholds.

      • calibrationAttribute as a string representing the attribute used to be calibrated.

      • min as a number representing the minimum values of the attribute, serving as the lowest range for calibration.

      • minIncluded as a boolean indicating whether or not to include the minimum value

      • max as a number representing the maximum values of the attribute, serving as the highest range for calibration.

      • maxIncluded as a boolean indicating whether or not to include the maximum value.

  • cleanAction as an object that includes the configuration specifics tied to the CLEAN operation.

    • conditionAutoClean as an object that includes the configurations specific to the auto-clean algorithm.

      • targetAttribute as a string representing target Yield values.

      • excludedAttributes as an array of strings defining attributes that don't influence the cleaning operation.

    • conditionMinMaxClean as an array of objects containing the described cleaning rules, every object includes the following parameters.

      • cleanAttribute as a string specifying the column name for the rule.

      • min as a number indicating the minimum value.

      • max as a number indicating the maximum value.

Documentation: YieldDataset query

As a GeoPard API consumer, you can retrieve details regarding the corrections applied to YieldDatasets through the attributes appliedCorrections and appliedCorrectionsVersion. The former provides a list of corrections made (e.g., CALIBRATE and CLEAN), with the order of execution denoted by their sequence in the array. Meanwhile, appliedCorrectionsVersion indicates the version of the algorithm employed.

query DetailsAboutAppliedCalibrations {
  getFields (filter: {fieldUuid: "<placeholder_of_field_uuid>"}){
    fields {
      uuid
      yieldDatasets  {
        uuid
        appliedCorrections
        appliedCorrectionsVersion
      }
    }
  }
}

To view the inputs and access the latest available values of enumerations (such as operations), it is recommended to utilize .

🤖
Altair
Yield Calibration & Cleaning
Original YieldDataset with WetMass attribute
Calibrated and Cleaned YieldDataset with WetMass attribute