> For the complete documentation index, see [llms.txt](https://docs.geopard.tech/geopard-tutorials/llms.txt). Markdown versions of documentation pages are available by appending `.md` to page URLs; this page is available as [Markdown](https://docs.geopard.tech/geopard-tutorials/product-tour-web-app/zones-maps-and-analytics/multi-year-zones.md).
# Multi-Year Zones
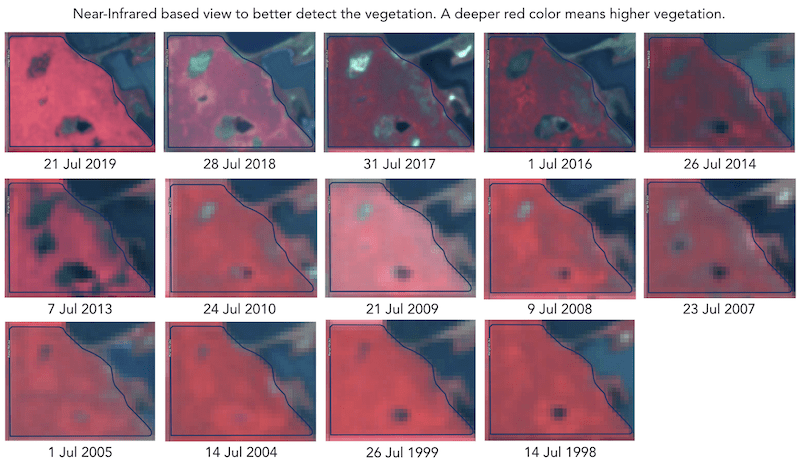
Historical (multi-year) management zones provide insights about every spot in the field.
Historical (multi-year) management zones are built based on 30+ years of the archive of satellite imagery. Images with peak vegetation during every season are automatically selected as inputs for analytics. Otherwise, every such image represents a potential yield file for the related year.
The field crop development pattern helps to know the agricultural area better and to apply the right decision with the right input rates in the right spots. Historical management zones could be used as a blueprint for prescription (Rx) files for seeding, fertilization, zones based soil sampling.
---
# Agent Instructions
This documentation is published with GitBook. GitBook is the documentation platform designed so that both humans and AI agents can read, navigate, and reason over technical content effectively. Learn more at gitbook.com.
## Querying This Documentation
If you need additional information that is not directly available in this page, you can query the documentation dynamically by asking a question.
Perform an HTTP GET request on the current page URL with the `ask` query parameter:
```
GET https://docs.geopard.tech/geopard-tutorials/product-tour-web-app/zones-maps-and-analytics/multi-year-zones.md?ask=
```
The question should be specific, self-contained, and written in natural language.
The response will contain a direct answer to the question and relevant excerpts and sources from the documentation.
Use this mechanism when the answer is not explicitly present in the current page, you need clarification or additional context, or you want to retrieve related documentation sections.