# Creating Zones Map using Soil/Yield/As Applied Data

If you want to create a Zones Map using some data set, make sure you upload the data first to your field.

1. Select the field in the list, click the **Create Zones Map** button, select Single-layer type, and then **Next**.
2. Select **Soil Data** (or Yield/As Applied Data) type to continue. Let’s proceed with the Soil Data option.

<figure><img src="https://lh4.googleusercontent.com/C_wDTmJfNc6C6dWxzpOMsjjoKYB_DtFTZyfEgRS1MU3vIfAH5iC91GDMXcTPPaEdh03P2i35OUiD70SltD3qJTci1c66hqzLqzrRQJ3X_ooFY1gofu9Ox000ajyIJjJ6aiqEVVEw" alt=""><figcaption></figcaption></figure>

3. In the next step select the specific soil data you want to proceed with and click **Next**.

<figure><img src="https://lh6.googleusercontent.com/yol4wcXBCKi0W9Xe8gW9EV3TePjDFlwww4CR4Hzgws0d5TbRnf72Z2_v793n_l56d3PJEqfTPRuhDAVe0kFwDV6n6Qn2MBShP-A3FNhS4XfgJu01mU1earnODGRQz6rV0m_kOtSk" alt=""><figcaption></figcaption></figure>

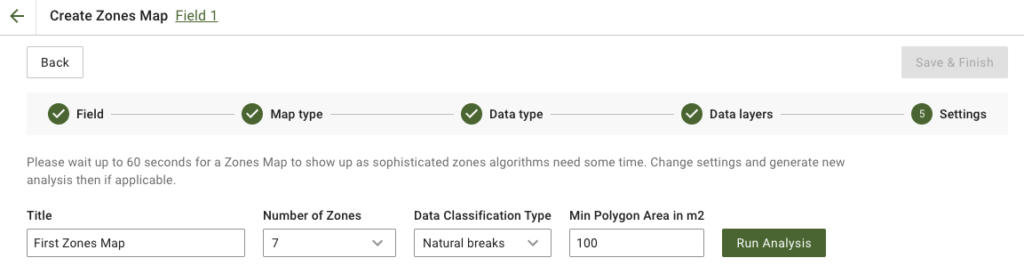
4. In the next step, you can edit the title, change the number of zones, [select a Data Classification Type](https://docs.geopard.tech/geopard-tutorials/product-tour-web-app/zones-maps-and-analytics/usage-of-data-classification), and define Minimum Polygon Area in square meters. Click **Run Analysis** to proceed.

<figure><img src="https://lh5.googleusercontent.com/4UztzLgbUVhE27CwOS1C00wmxGZUmGahpsJJhSfA1Hn7orvXDX7Ck73Yf7FkzaPr9M6nJNTNHdYMnFGX8tNFGzBHjDt_DrdFMk3Ga5h7_AqHYJgjGBEiHkN8L0mbPzT3g87Y_z-p" alt="This image has an empty alt attribute; its file name is 28-1.png"><figcaption></figcaption></figure>

The analysis may run for up to 60 seconds, depending on the parameters you have specified.

5. Once it is finished, click **Save & Finish**.

<figure><img src="https://lh3.googleusercontent.com/QvpdbCtZjNVqqKrdSM7FuXglnFfhIWgL7X-W2GrN0RhcVNSZykvifa9oy_QWdHEY3uxZKkyjCwgSTPMslJDKT95KXCypLuDvAviPNP-rCbBcRWWxho-oiYwQ1XfGY3uQnQCKOiUA" alt=""><figcaption></figcaption></figure>

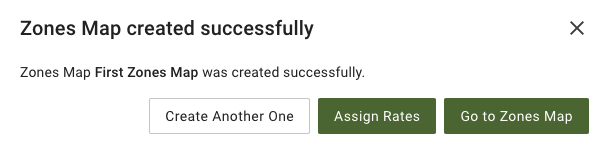
After it is saved, you will see the following message:

<figure><img src="https://lh5.googleusercontent.com/ffyviBeu6q4EpdXWP2APxsUcNhb3CRFuPp9xHHDIlIMhNzu--1ltDlFLtcVxTqXFRksmBr_IfzHHKVxm_3Ckw7HJdcFGQRFN34VMFbeGVjIjWrNcgUACekrOs60Dc-YRUHg4ie7p" alt="This image has an empty alt attribute; its file name is 30-1.png"><figcaption></figcaption></figure>

You can either create another zones map, assign the rates or go to the Zones map you have just created. If you navigate to the zone map you will see a similar view.

<figure><img src="https://lh5.googleusercontent.com/FTY8Lx3mahAgt0YsaICoXCb5ybzs56I85YIu-eJ2HIOKlm6cJwulnRJd3c3g6kclM4uPBGmIXSjZVYA7liLeUeg4HC5feougC6R6ilfbNKyBDUxYNuRrmHloPKbqYucElSK3LUSF" alt=""><figcaption></figcaption></figure>
