
Raw Satellite Images
Raw Satellite Images

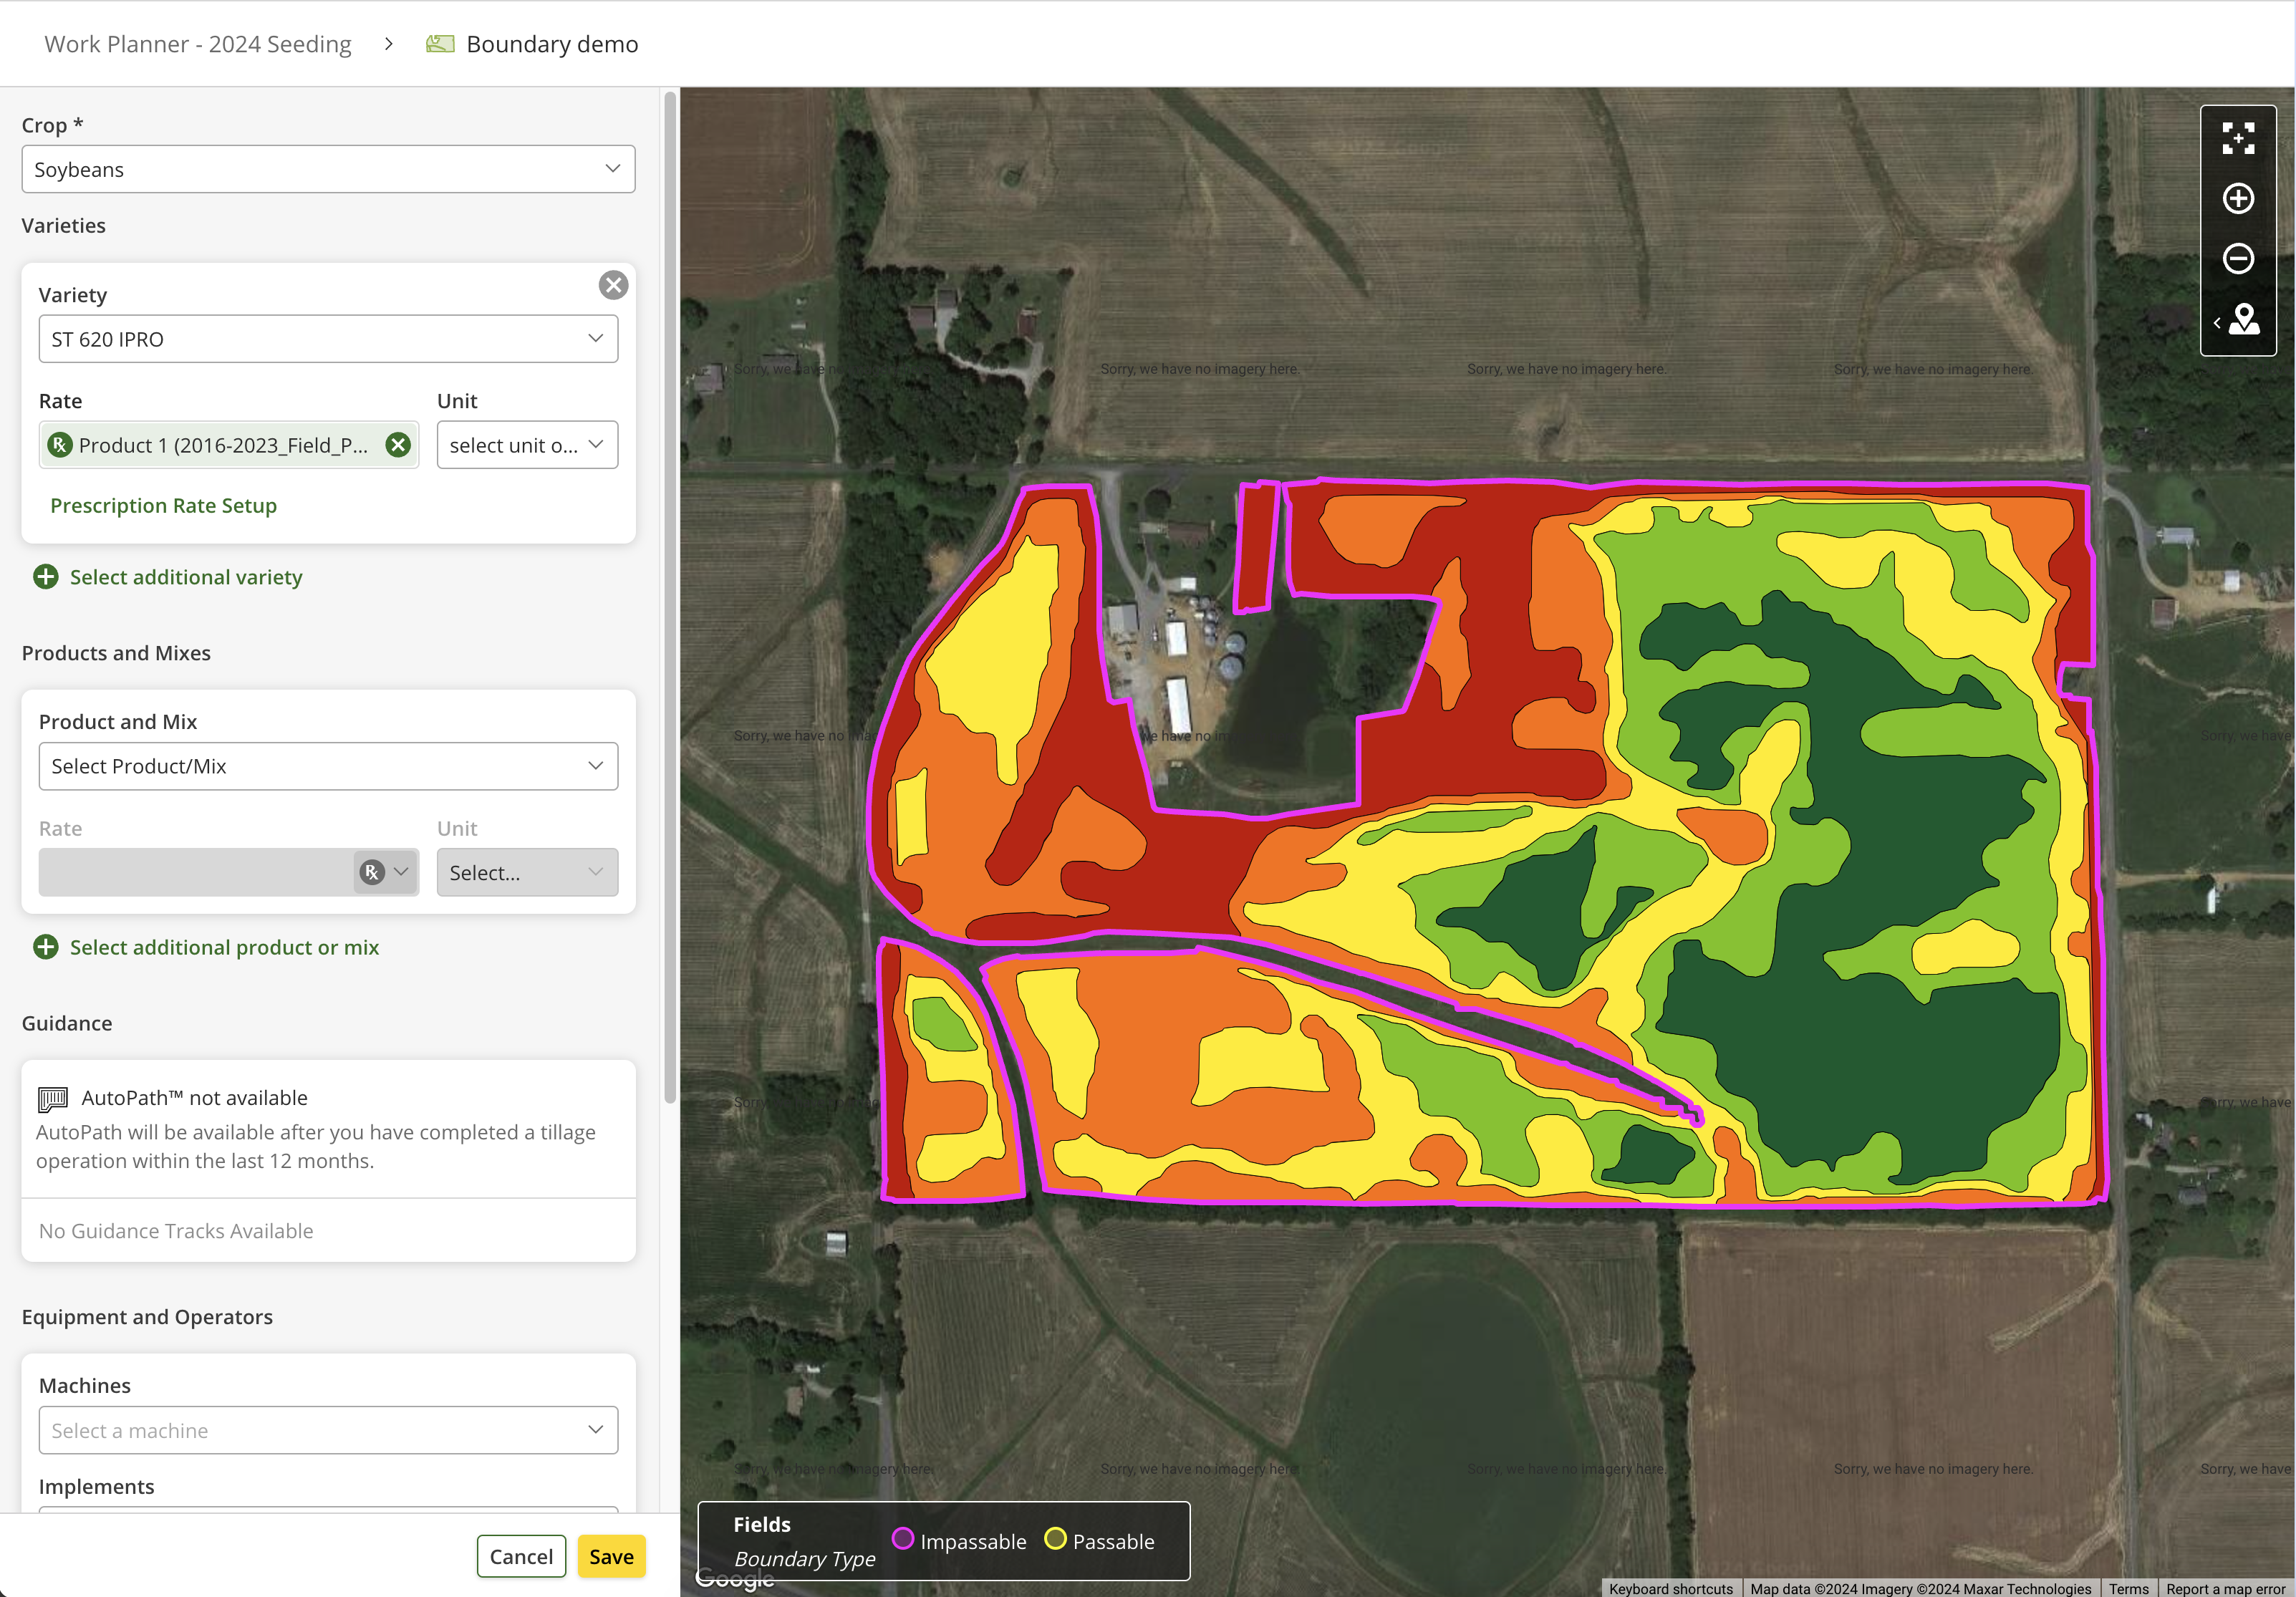
Export Seeding Zones Map as Work Plan to John Deere Ops Center - GeoPard
Export Seeding Zones Map as Work Plan to John Deere Ops Center - JD Ops Center

Data Restoration at FIeld Boundary Edges
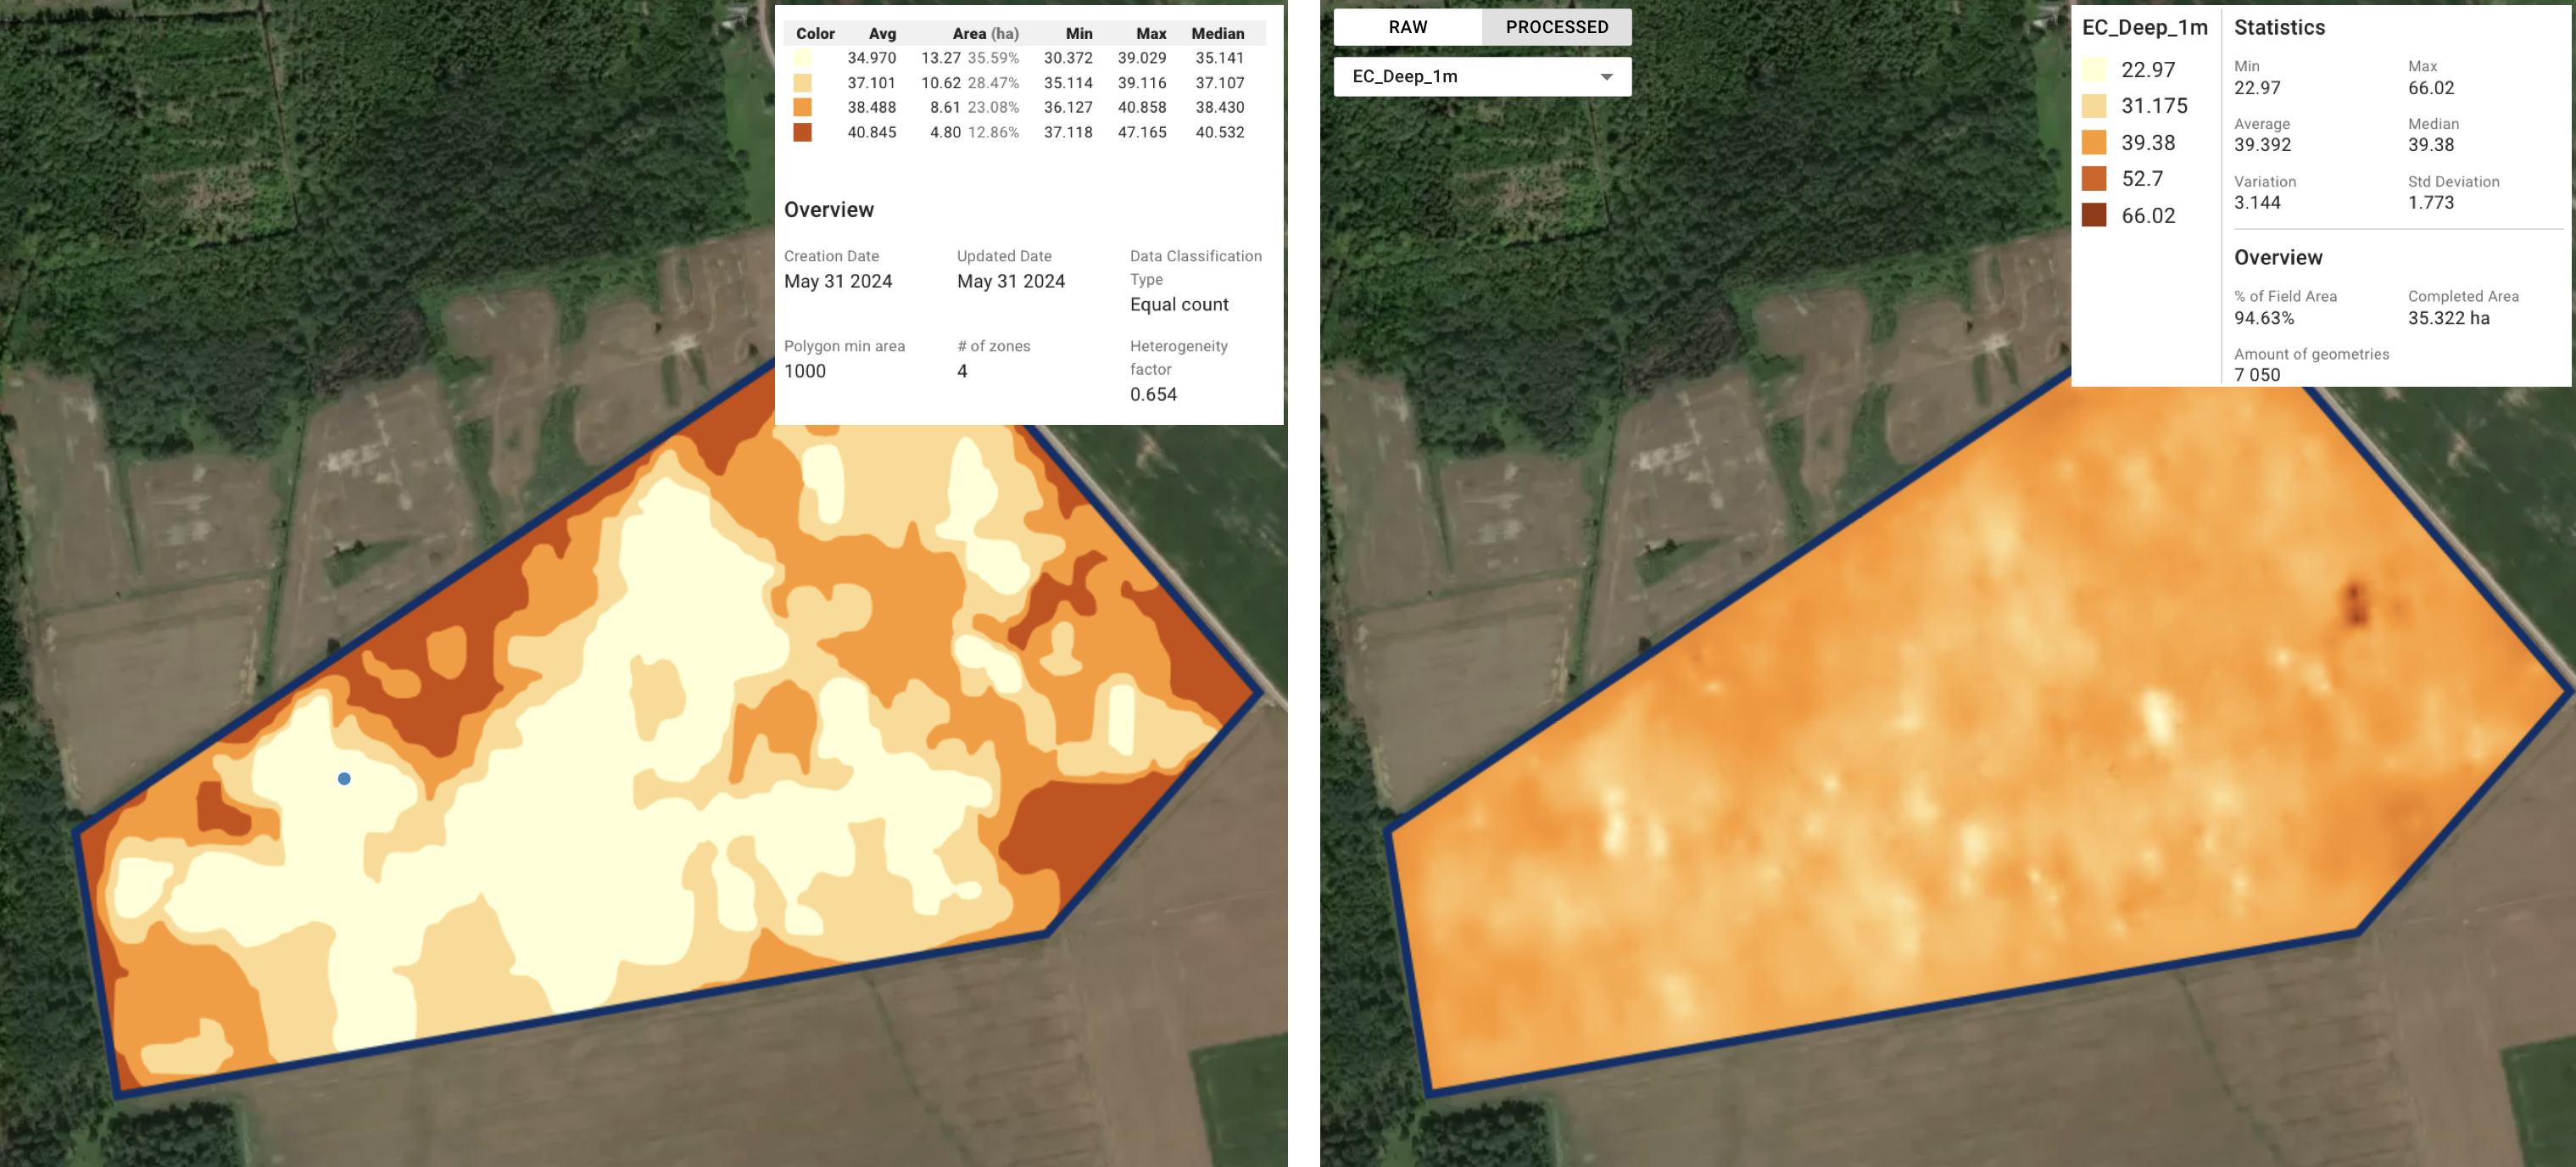
Zones Map vs Restored Soil Dataset
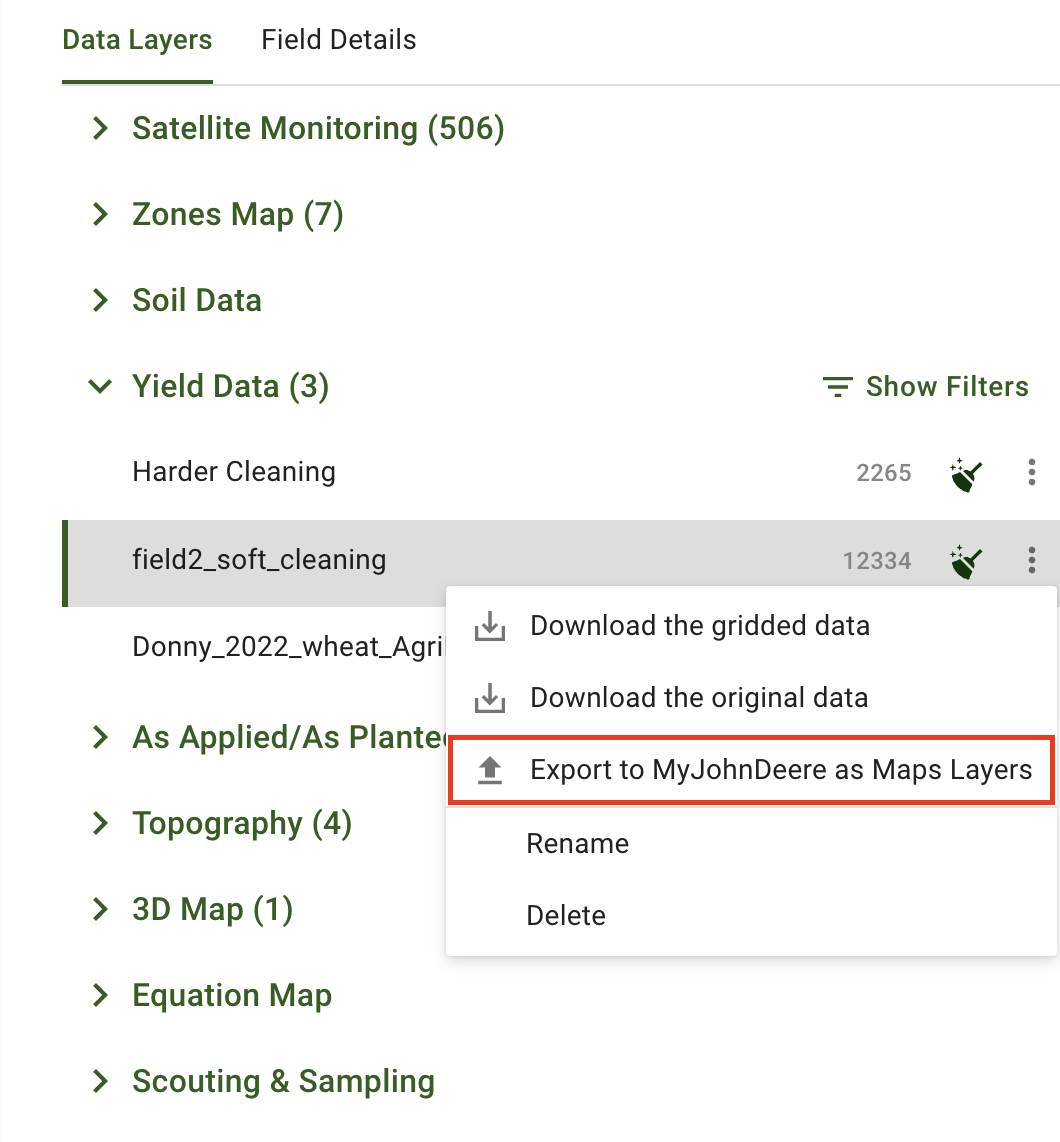
Export Yield Dataset as Map Layers to John Deere Operations Center - Export Manually
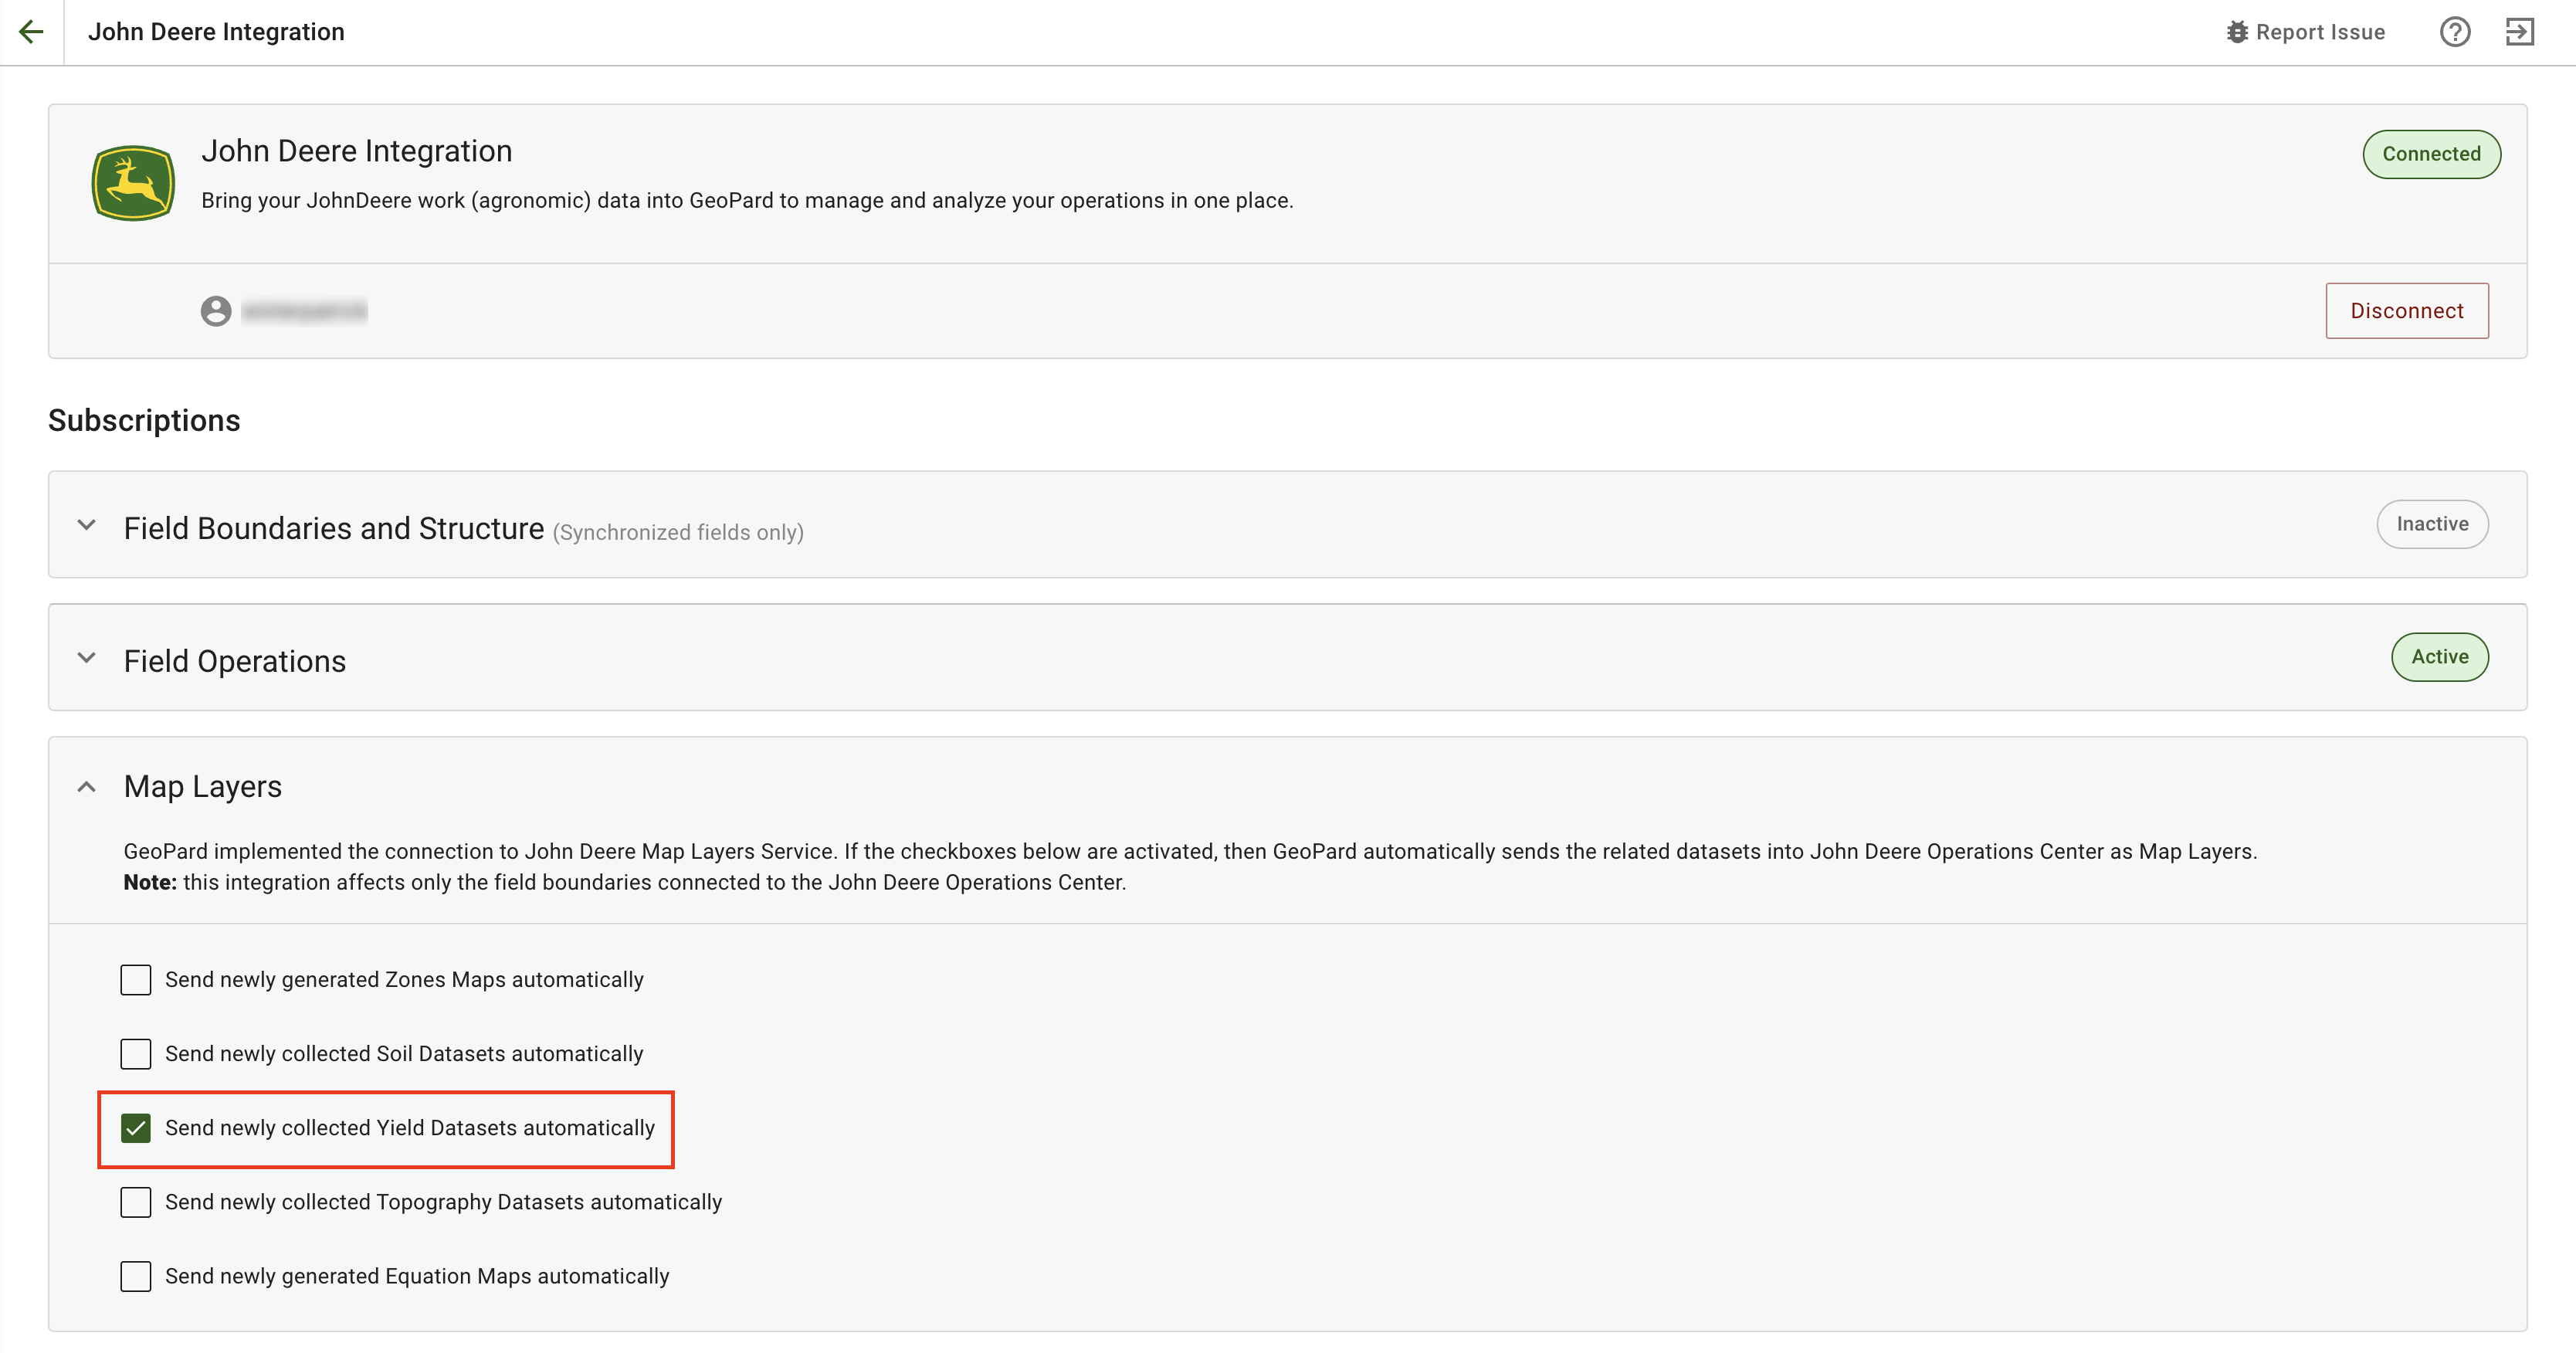
Export Yield Dataset as Map Layers to John Deere Operations Center - Send Automatically
Export Yield Dataset as Map Layers to John Deere Operations Center - JD Ops Center

Redesigned Batch Analysis Preview Step

Title Template for Batch Analysis

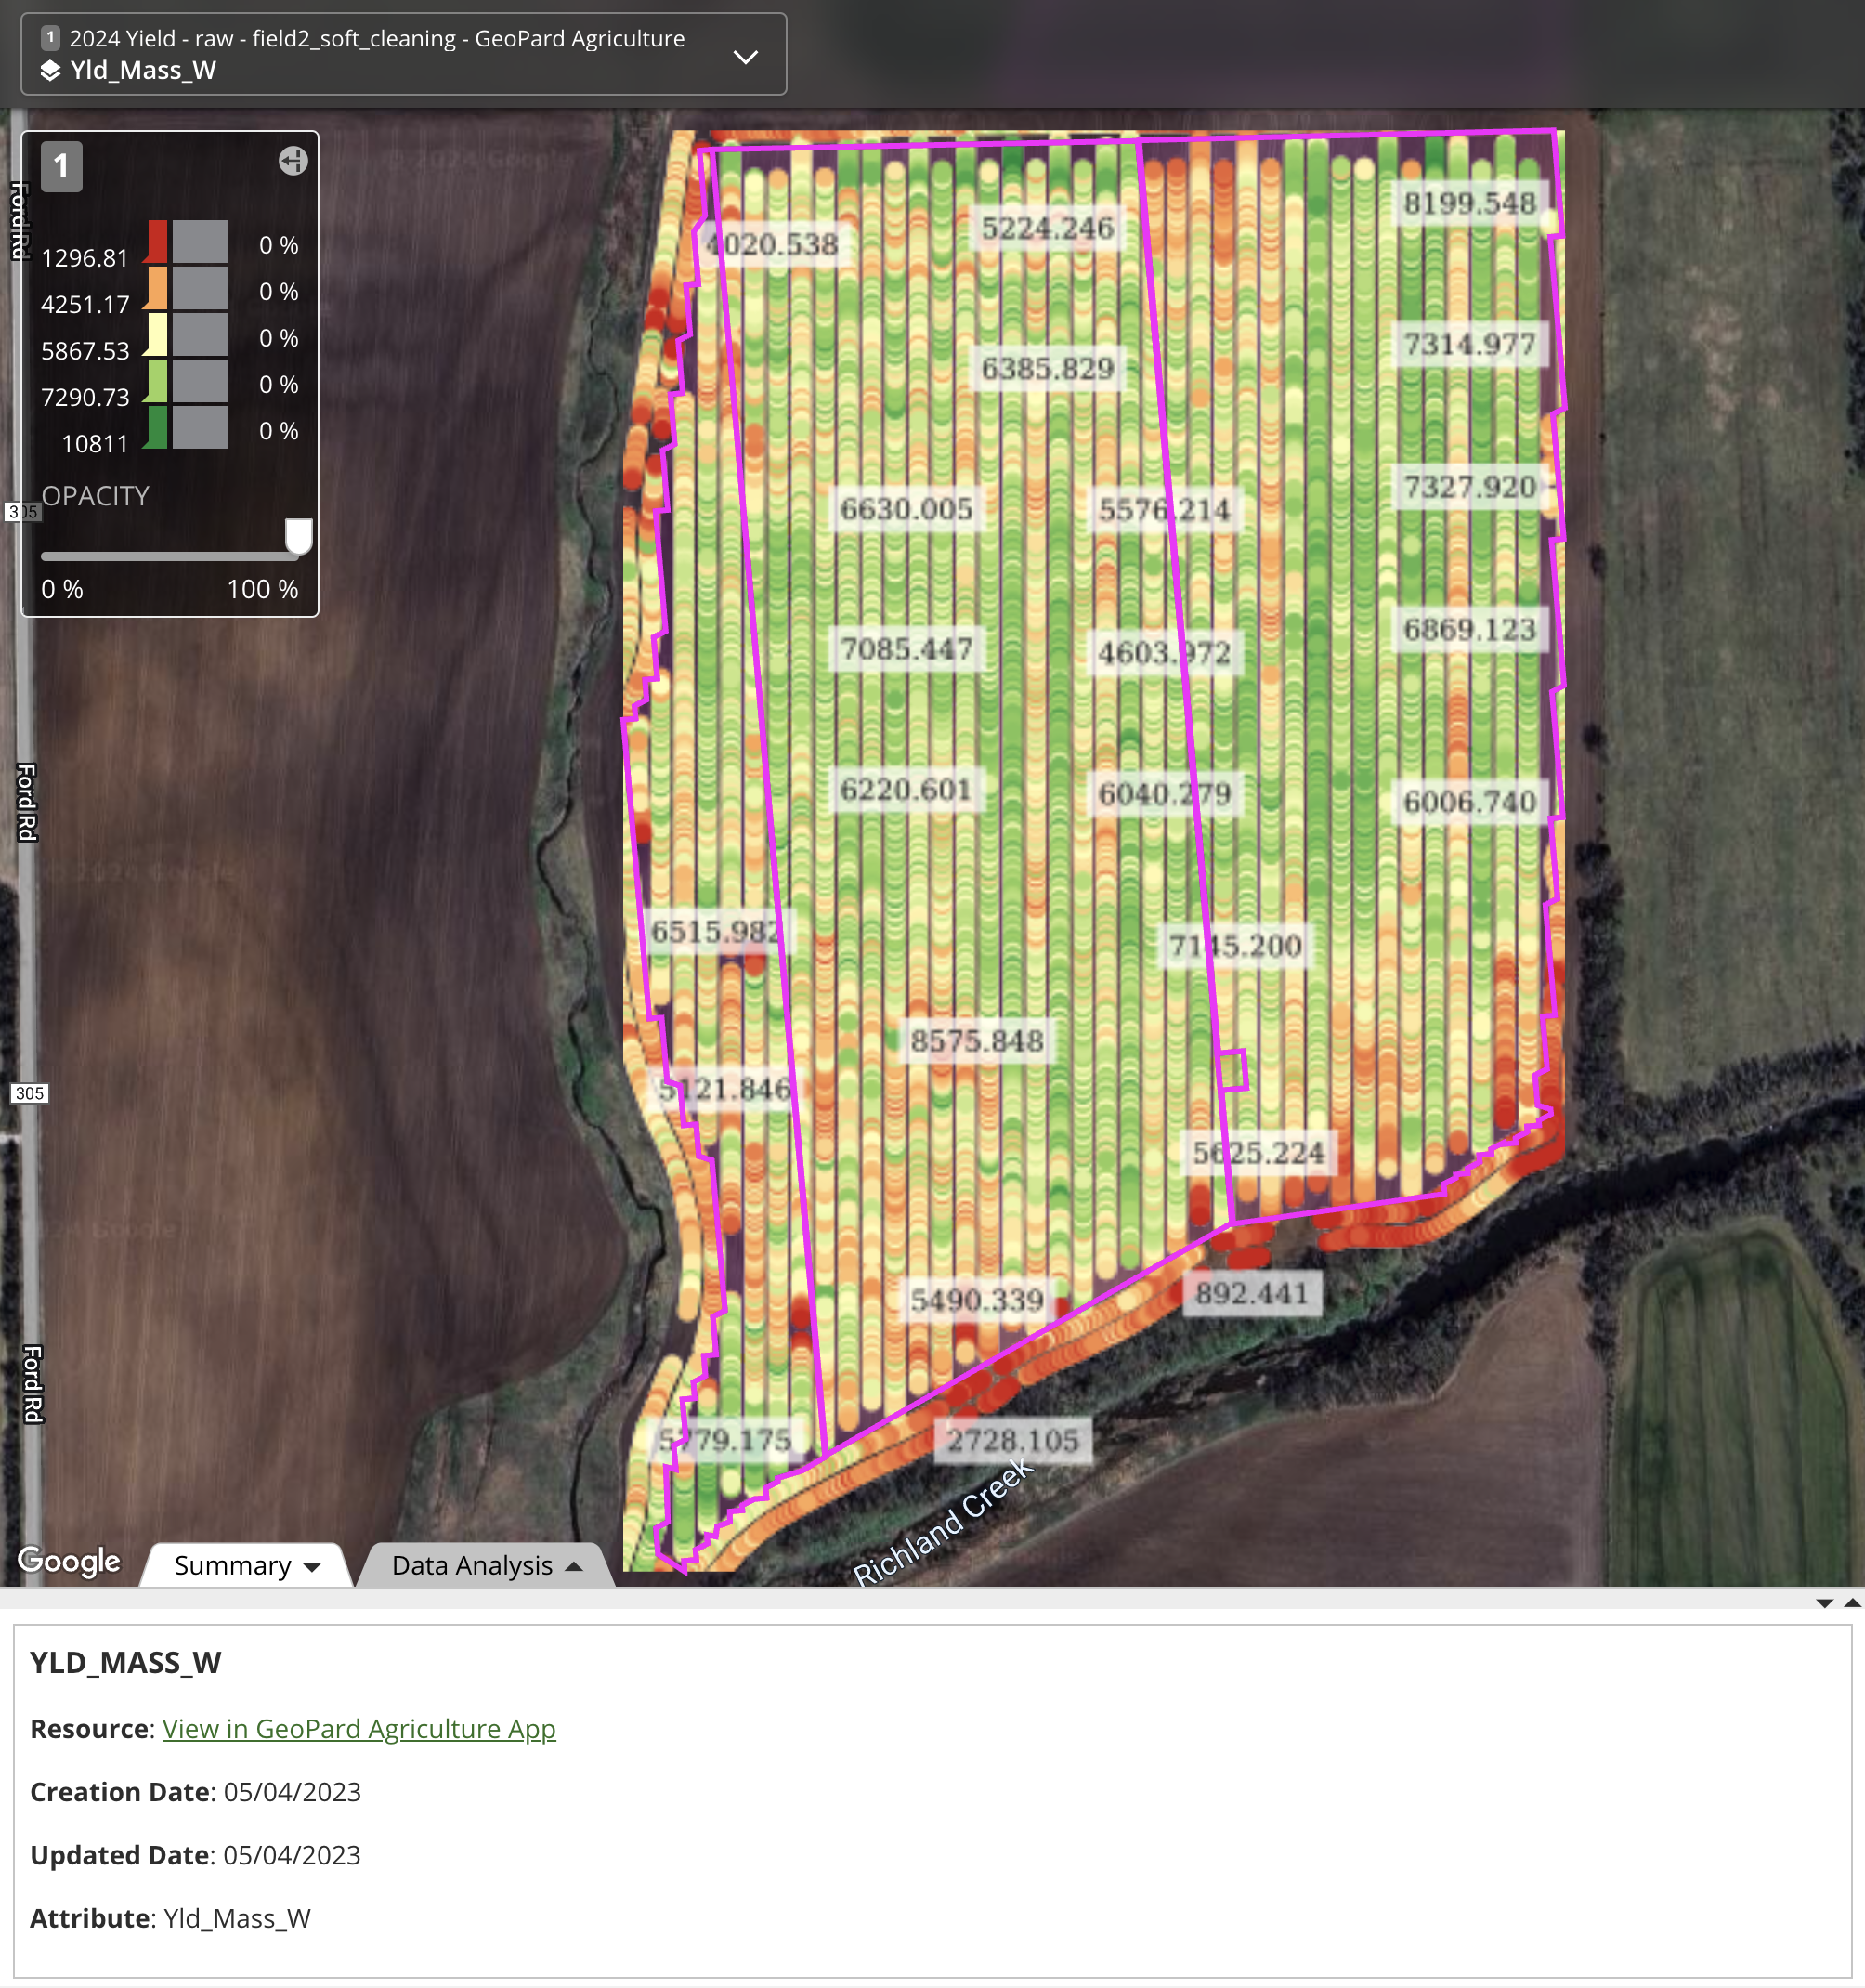
Yield Variable Mapping to Cleaned or Calibrated Datasets
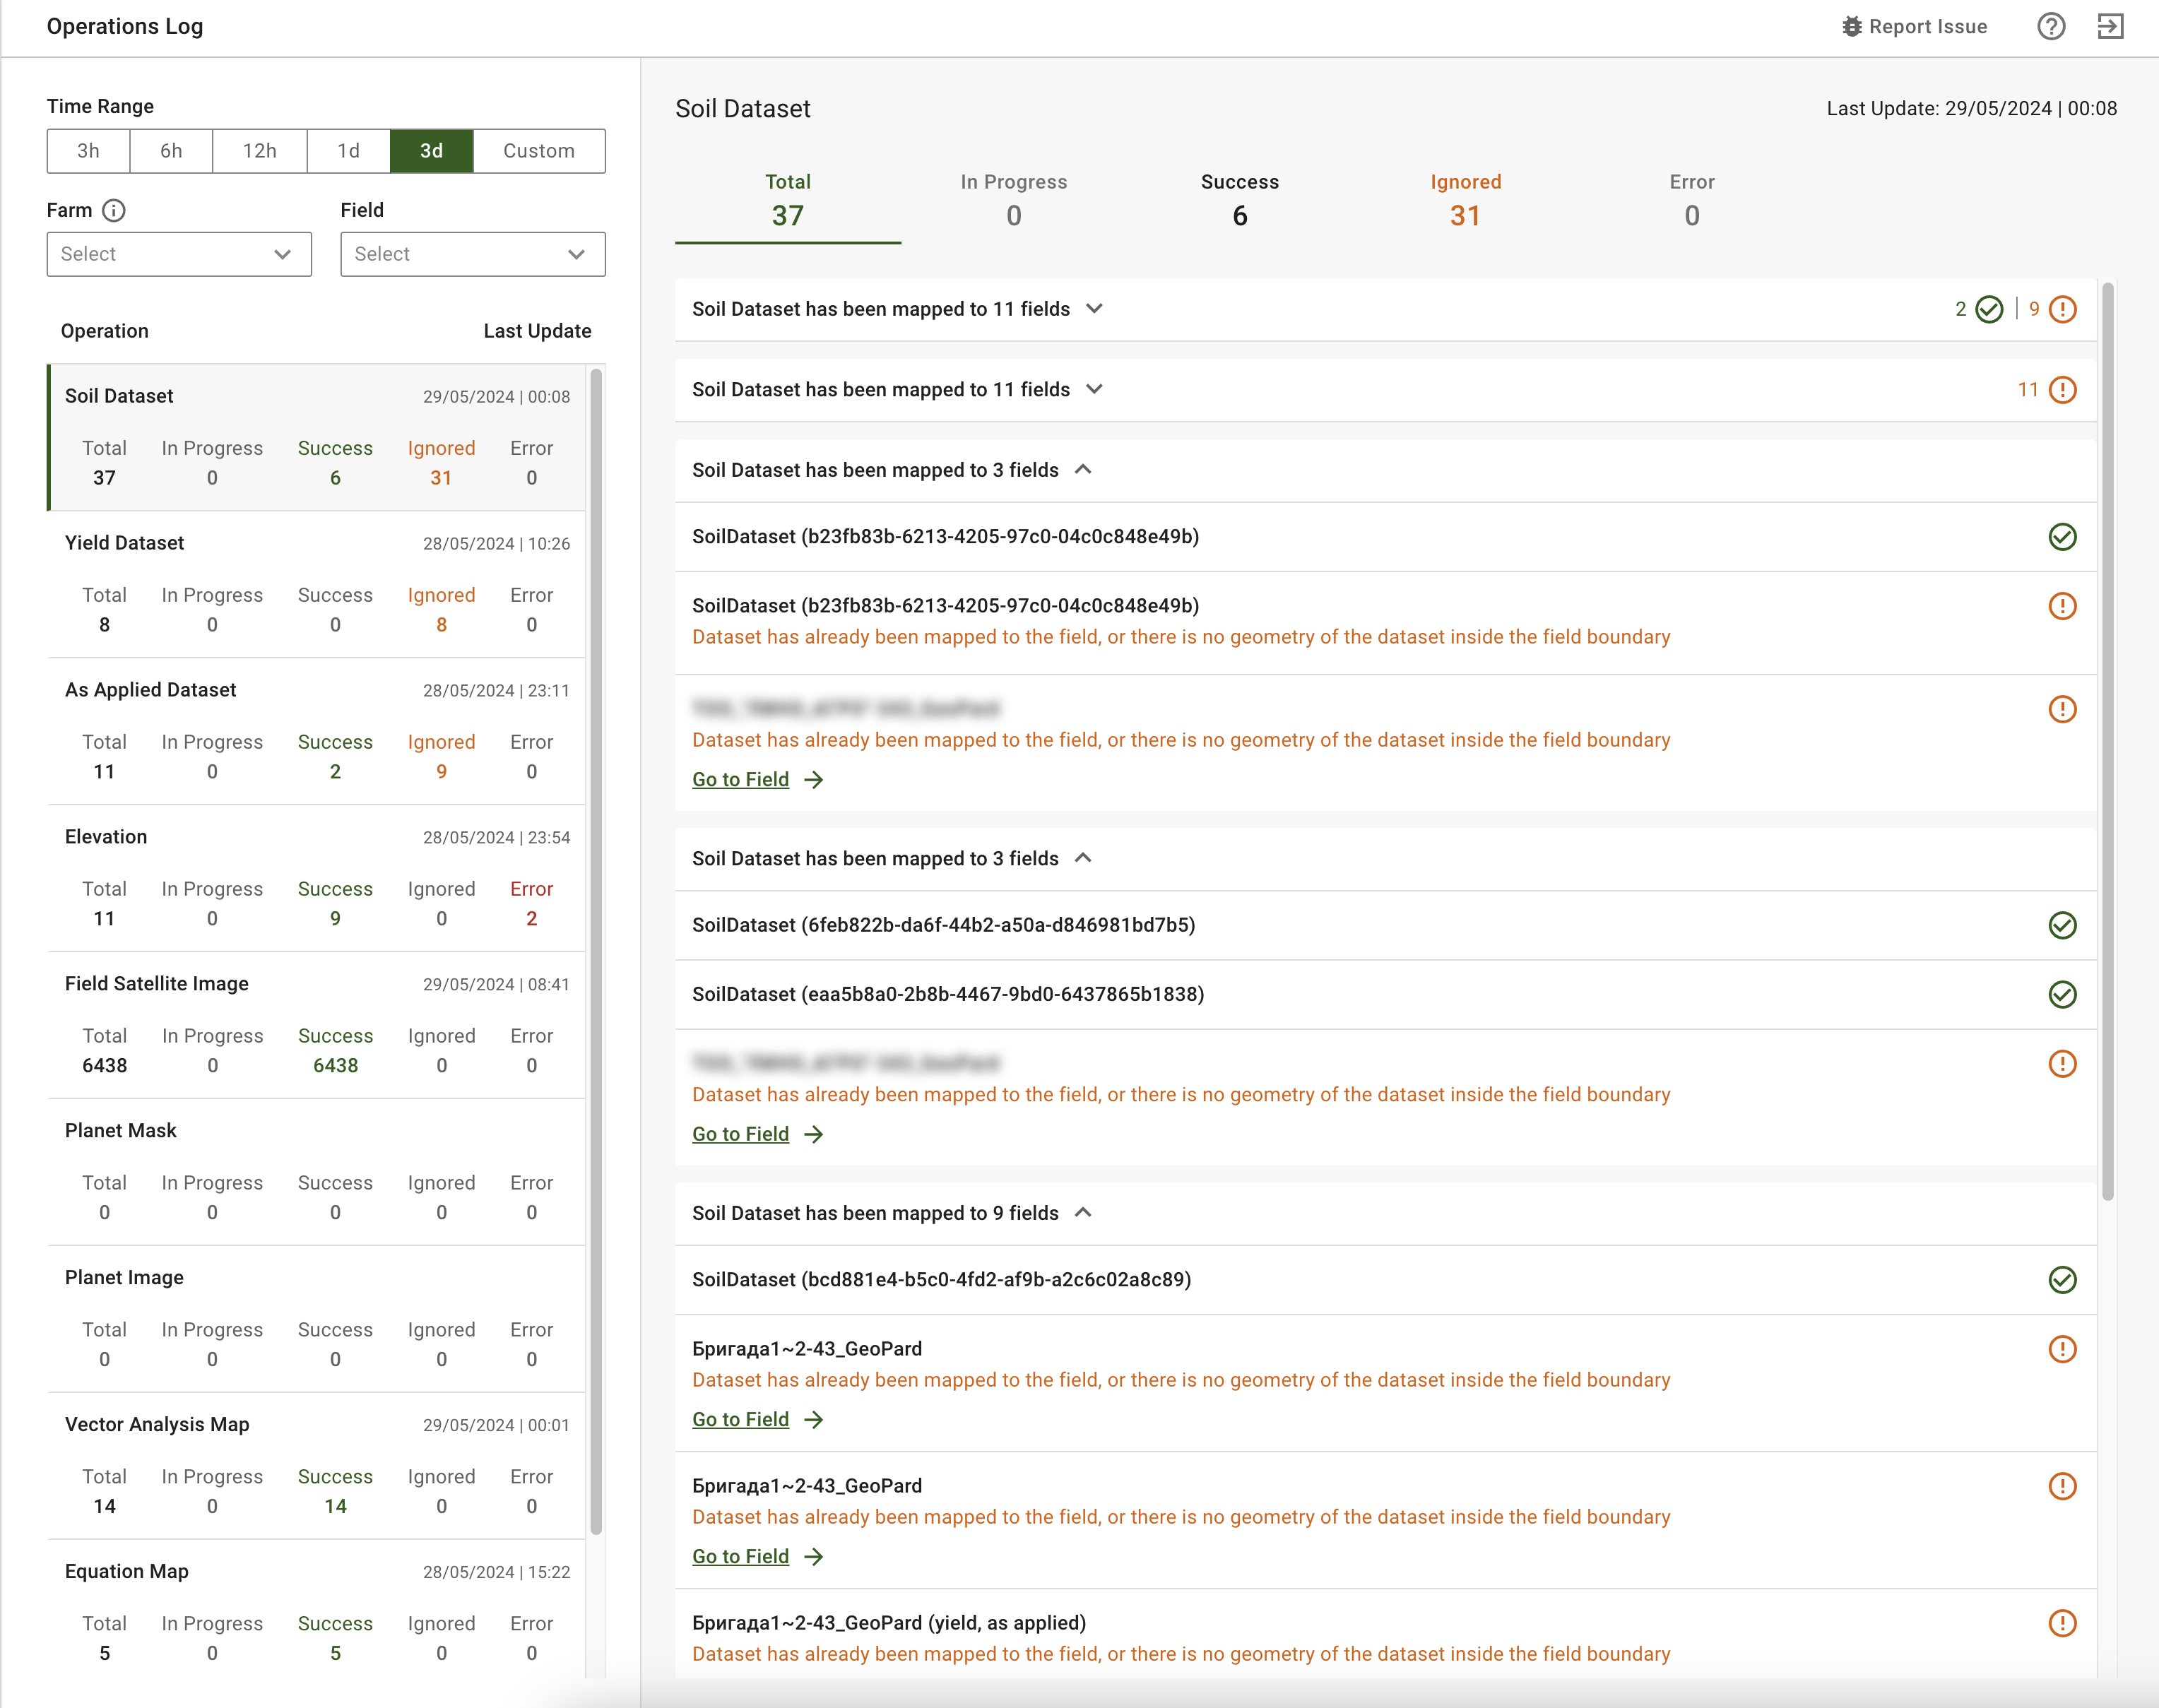
Refined Operations Log Events
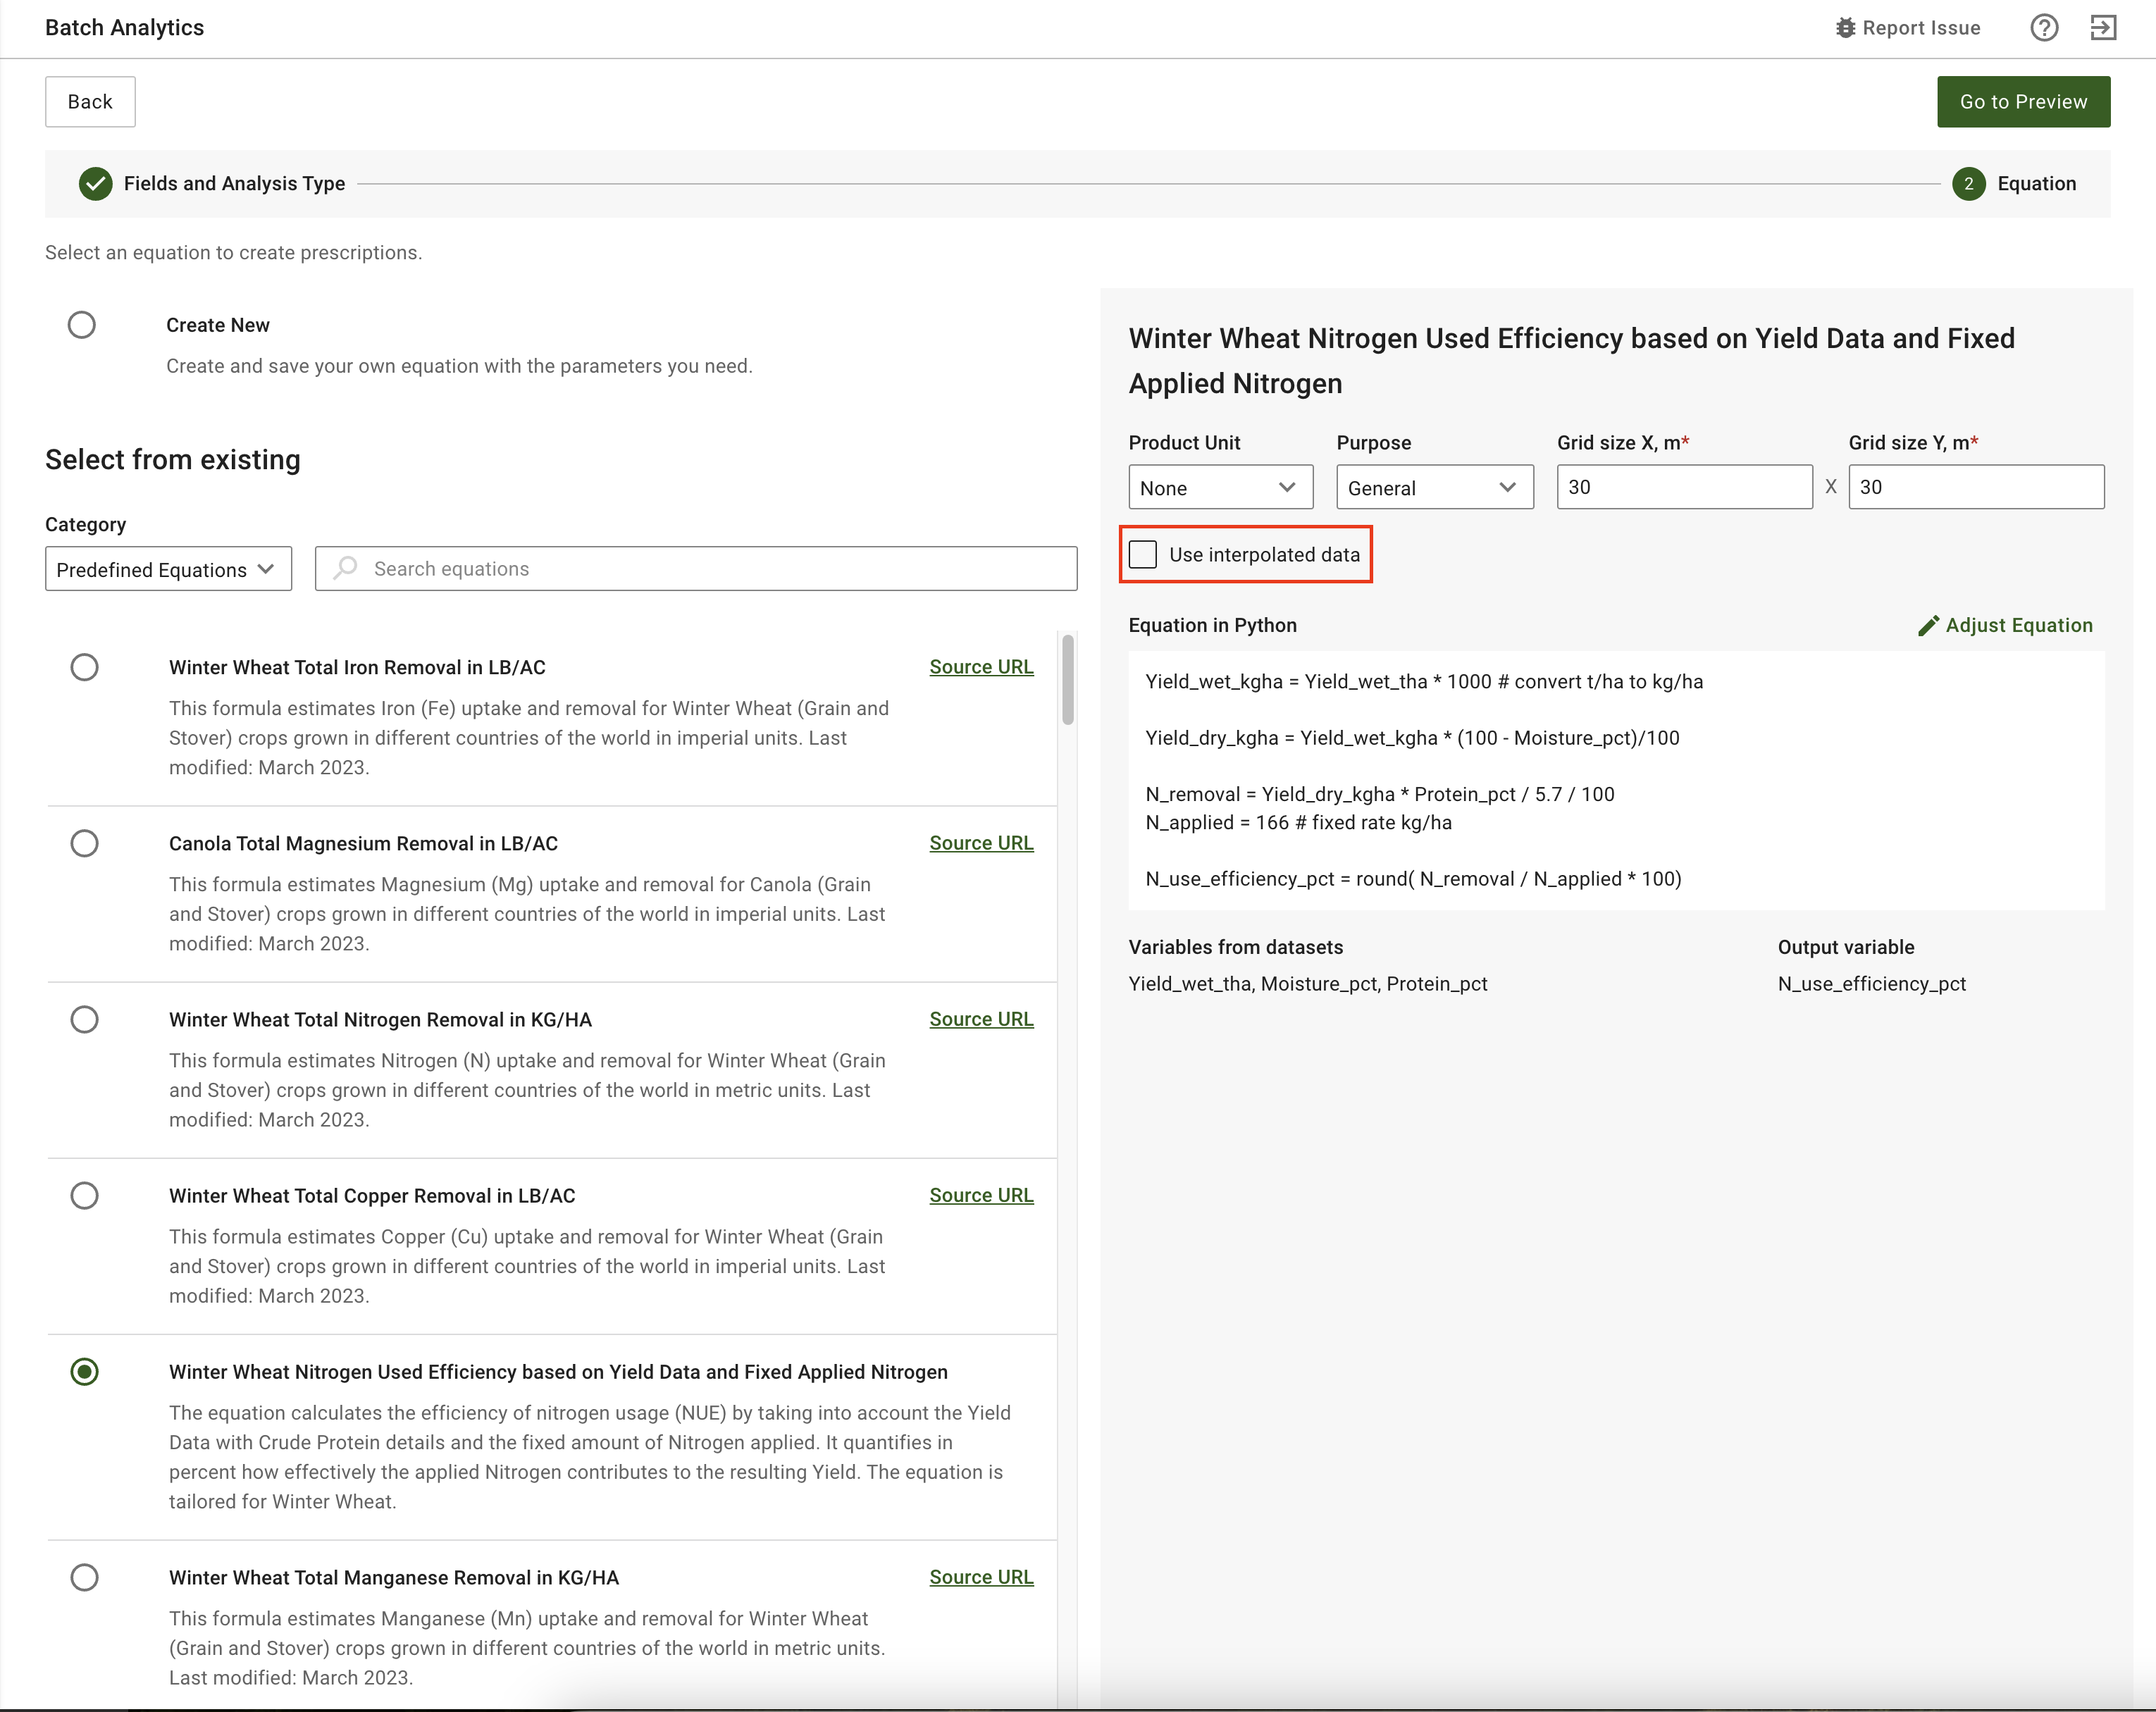
Interpolation in Batch Analysis - Equation step

Interpolation in Batch Analysis - Preview step
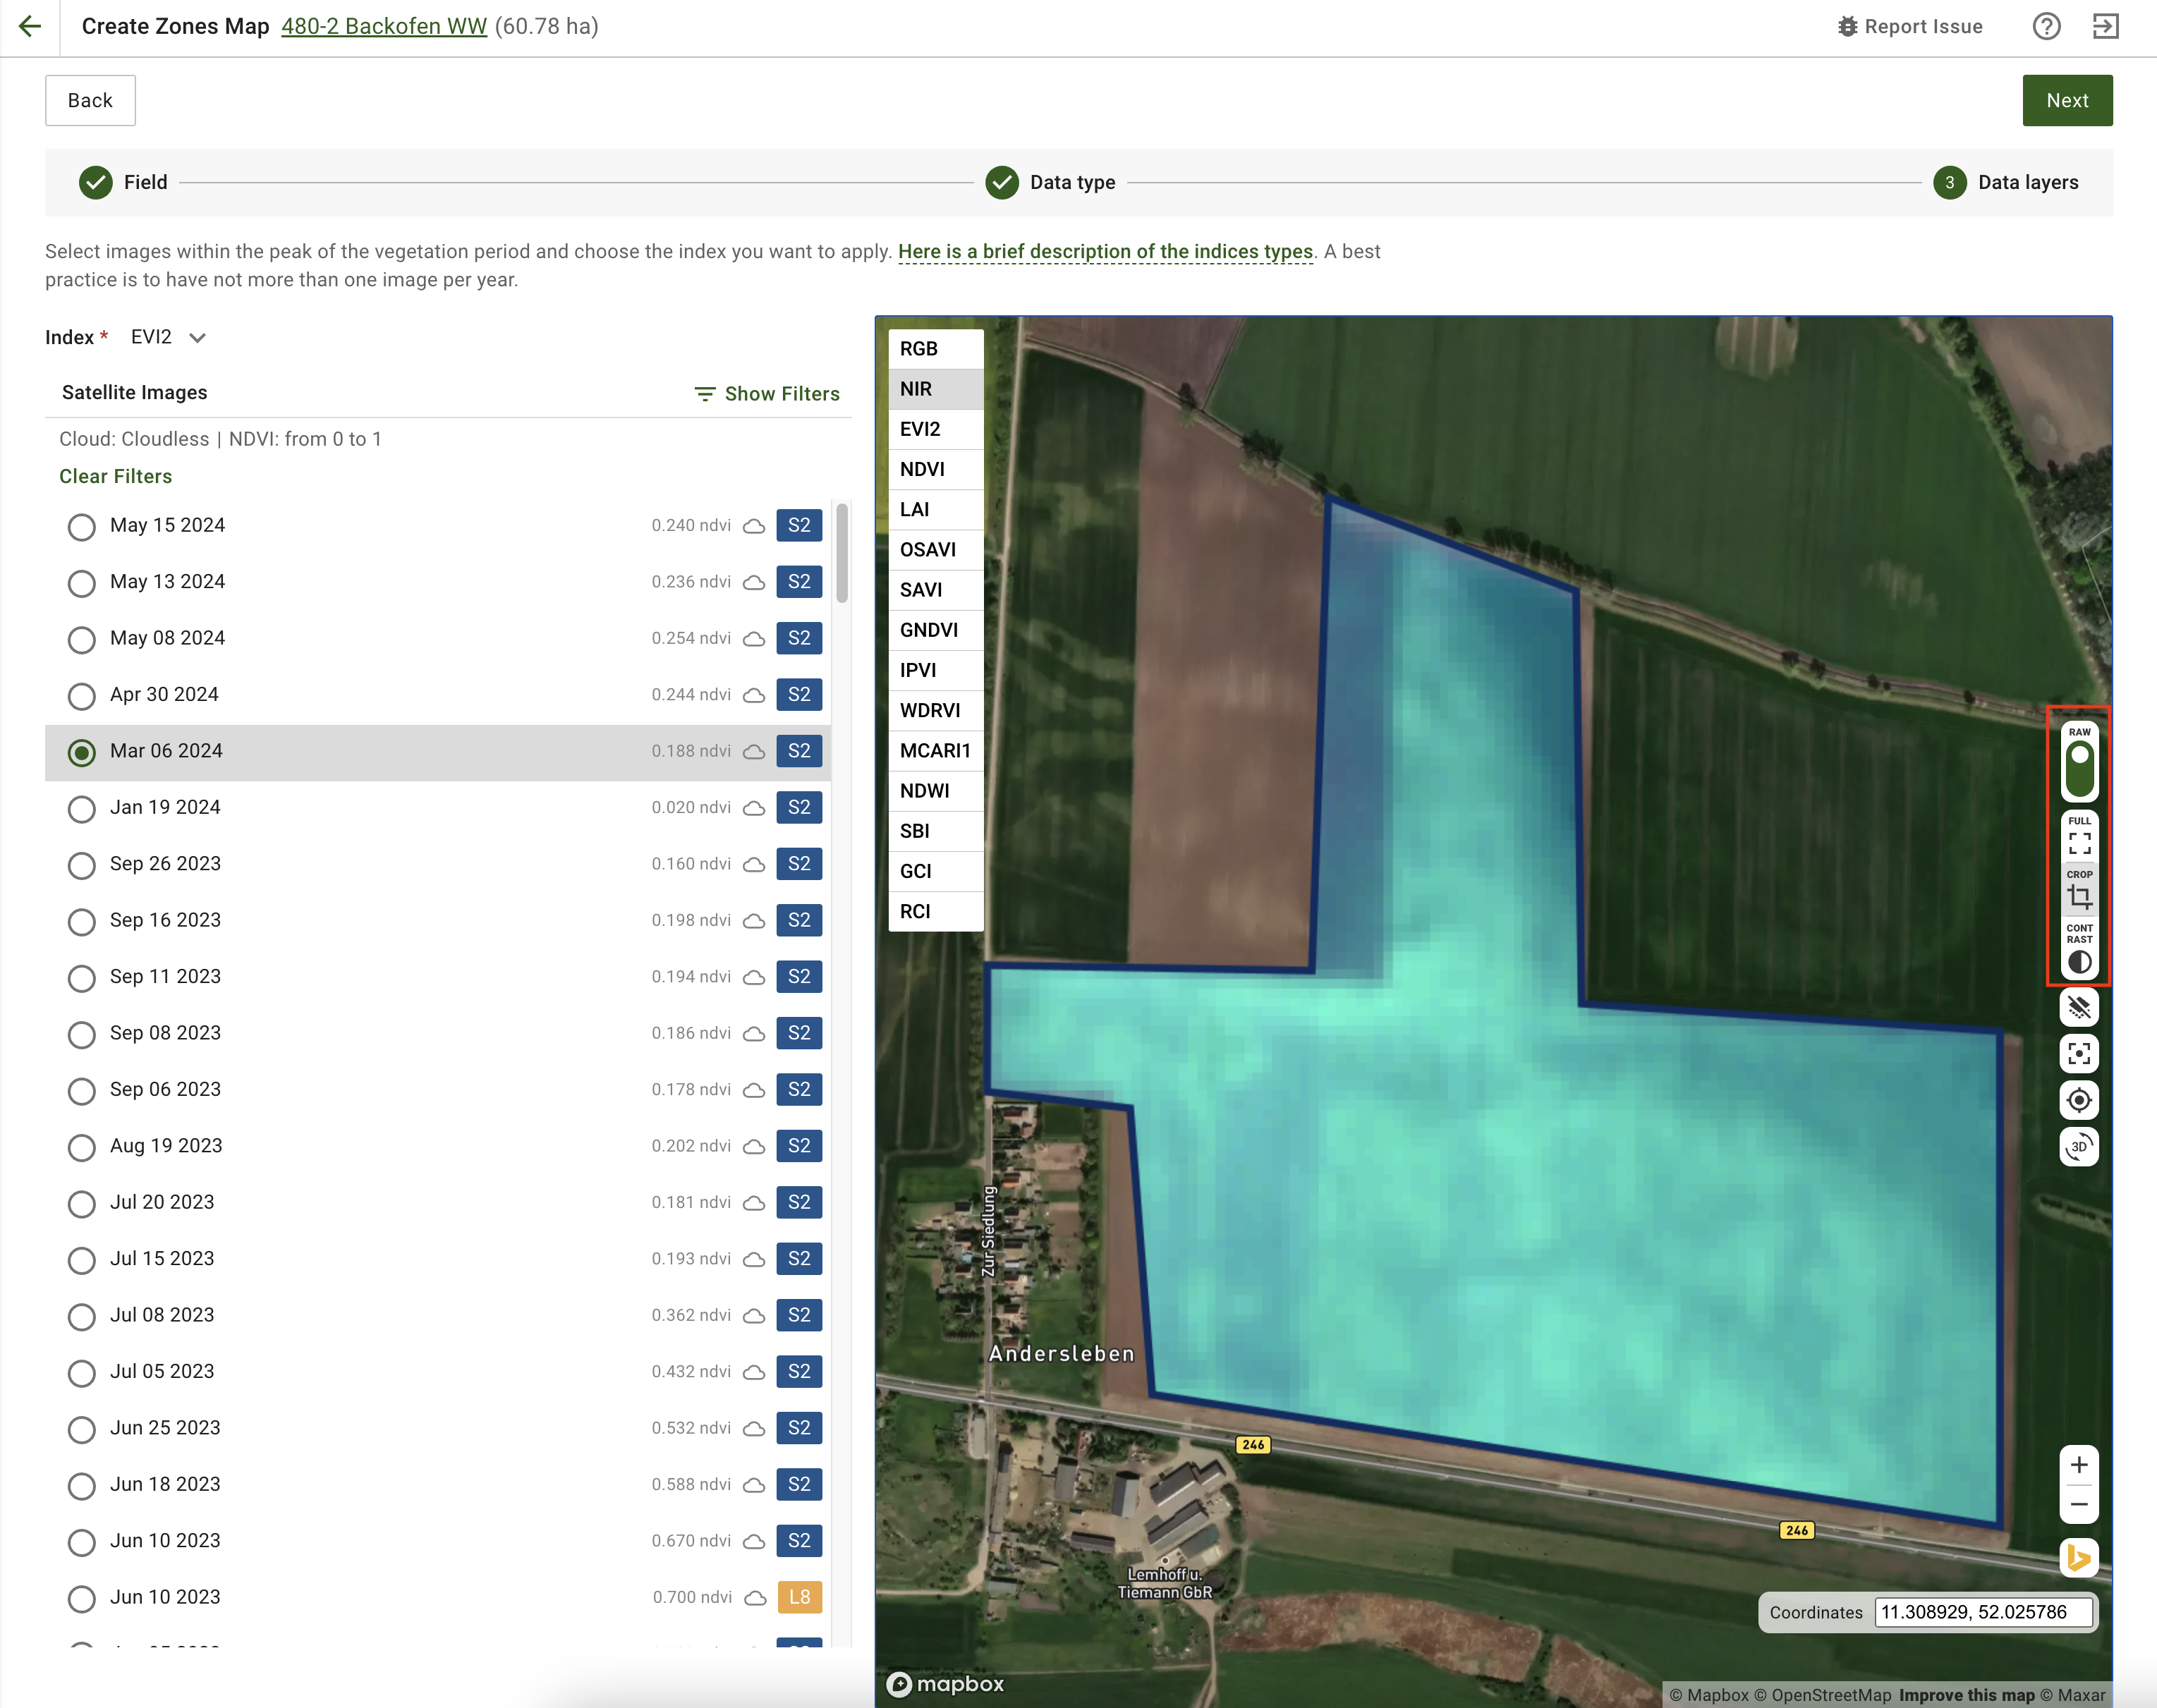
Contrast Controls In Zones Maps Creation

Contrast Controls in Compare Layers Mode
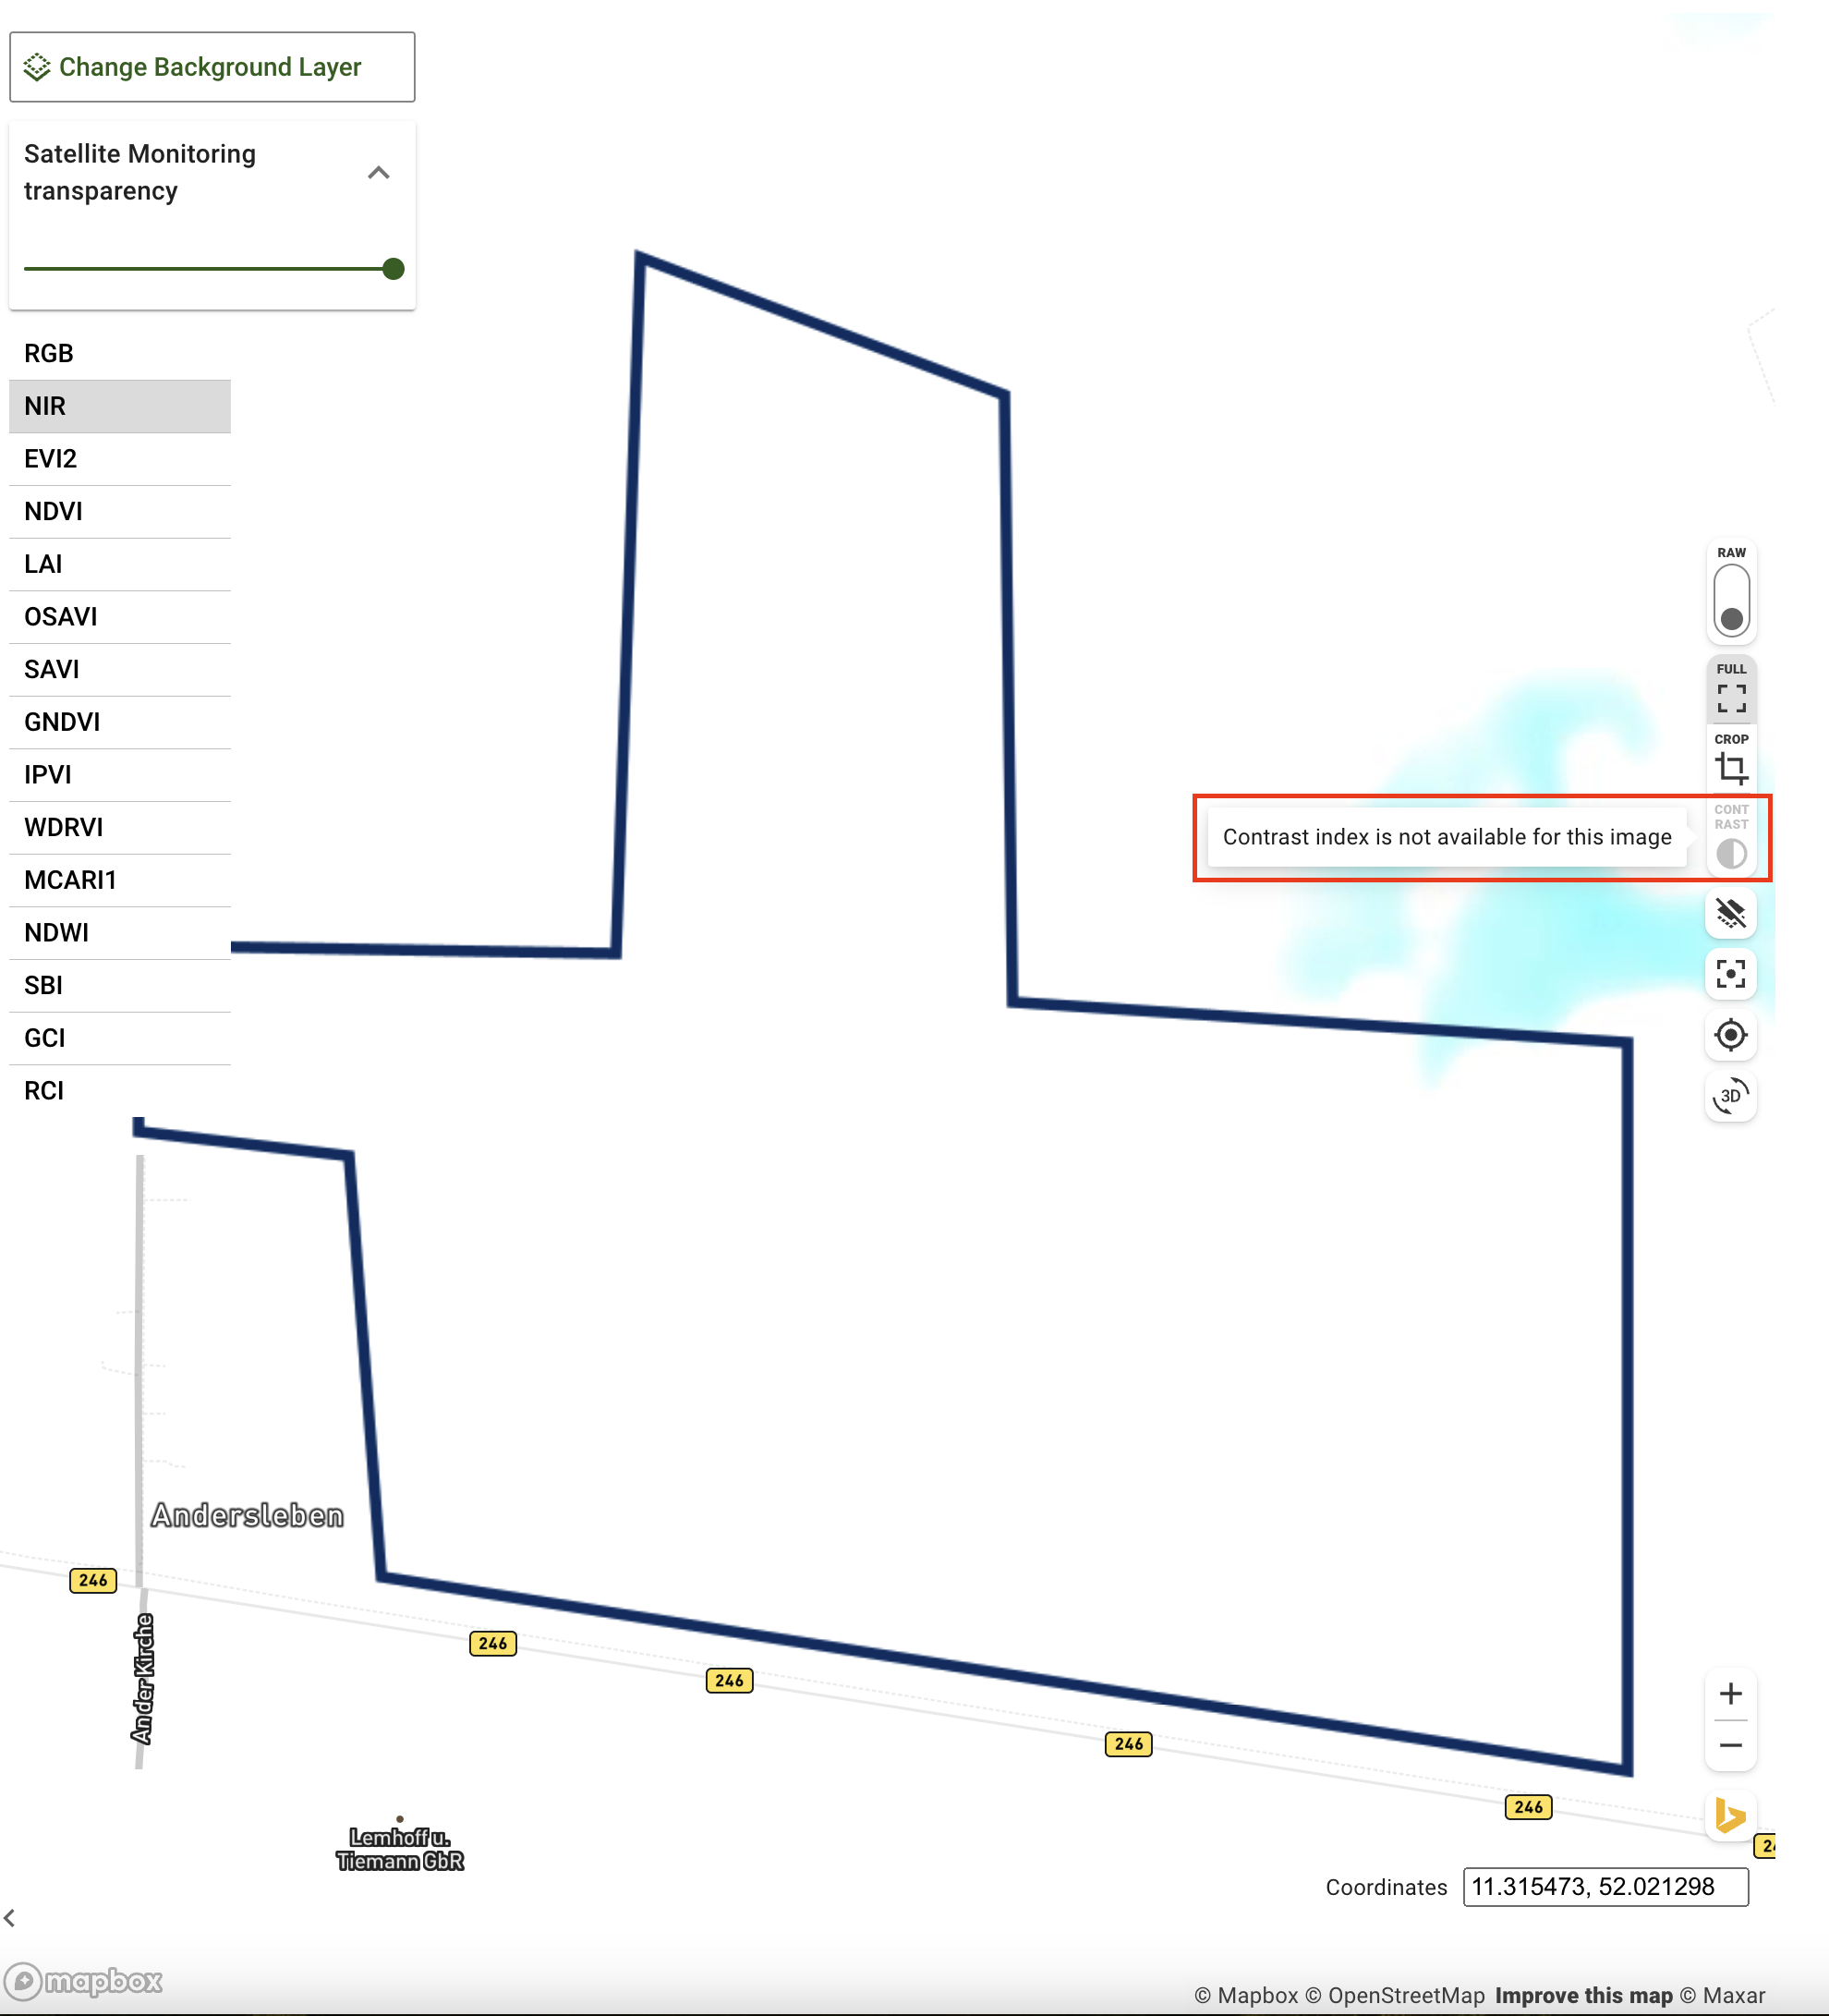
Improved Satellite Images Contrast Control

Faster Map Rendering with Optimized Tile Requests
Improved variables auto-assignment for Batch Analysis
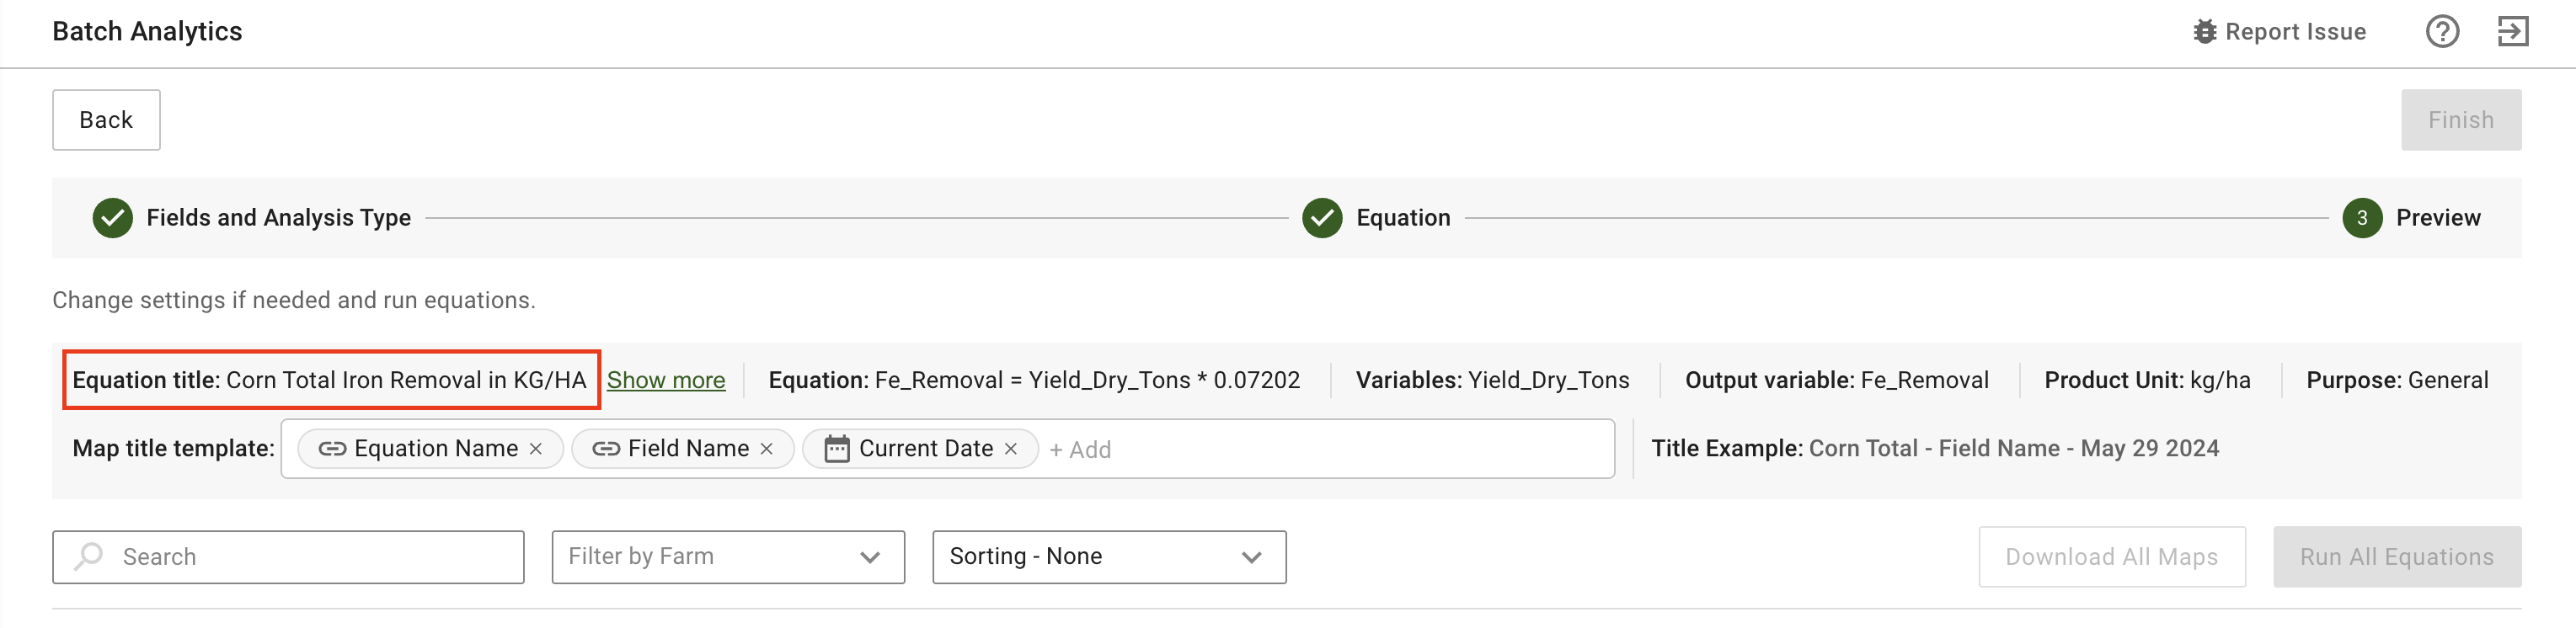
Equation Title in Batch Equation Maps Flow - collapsed
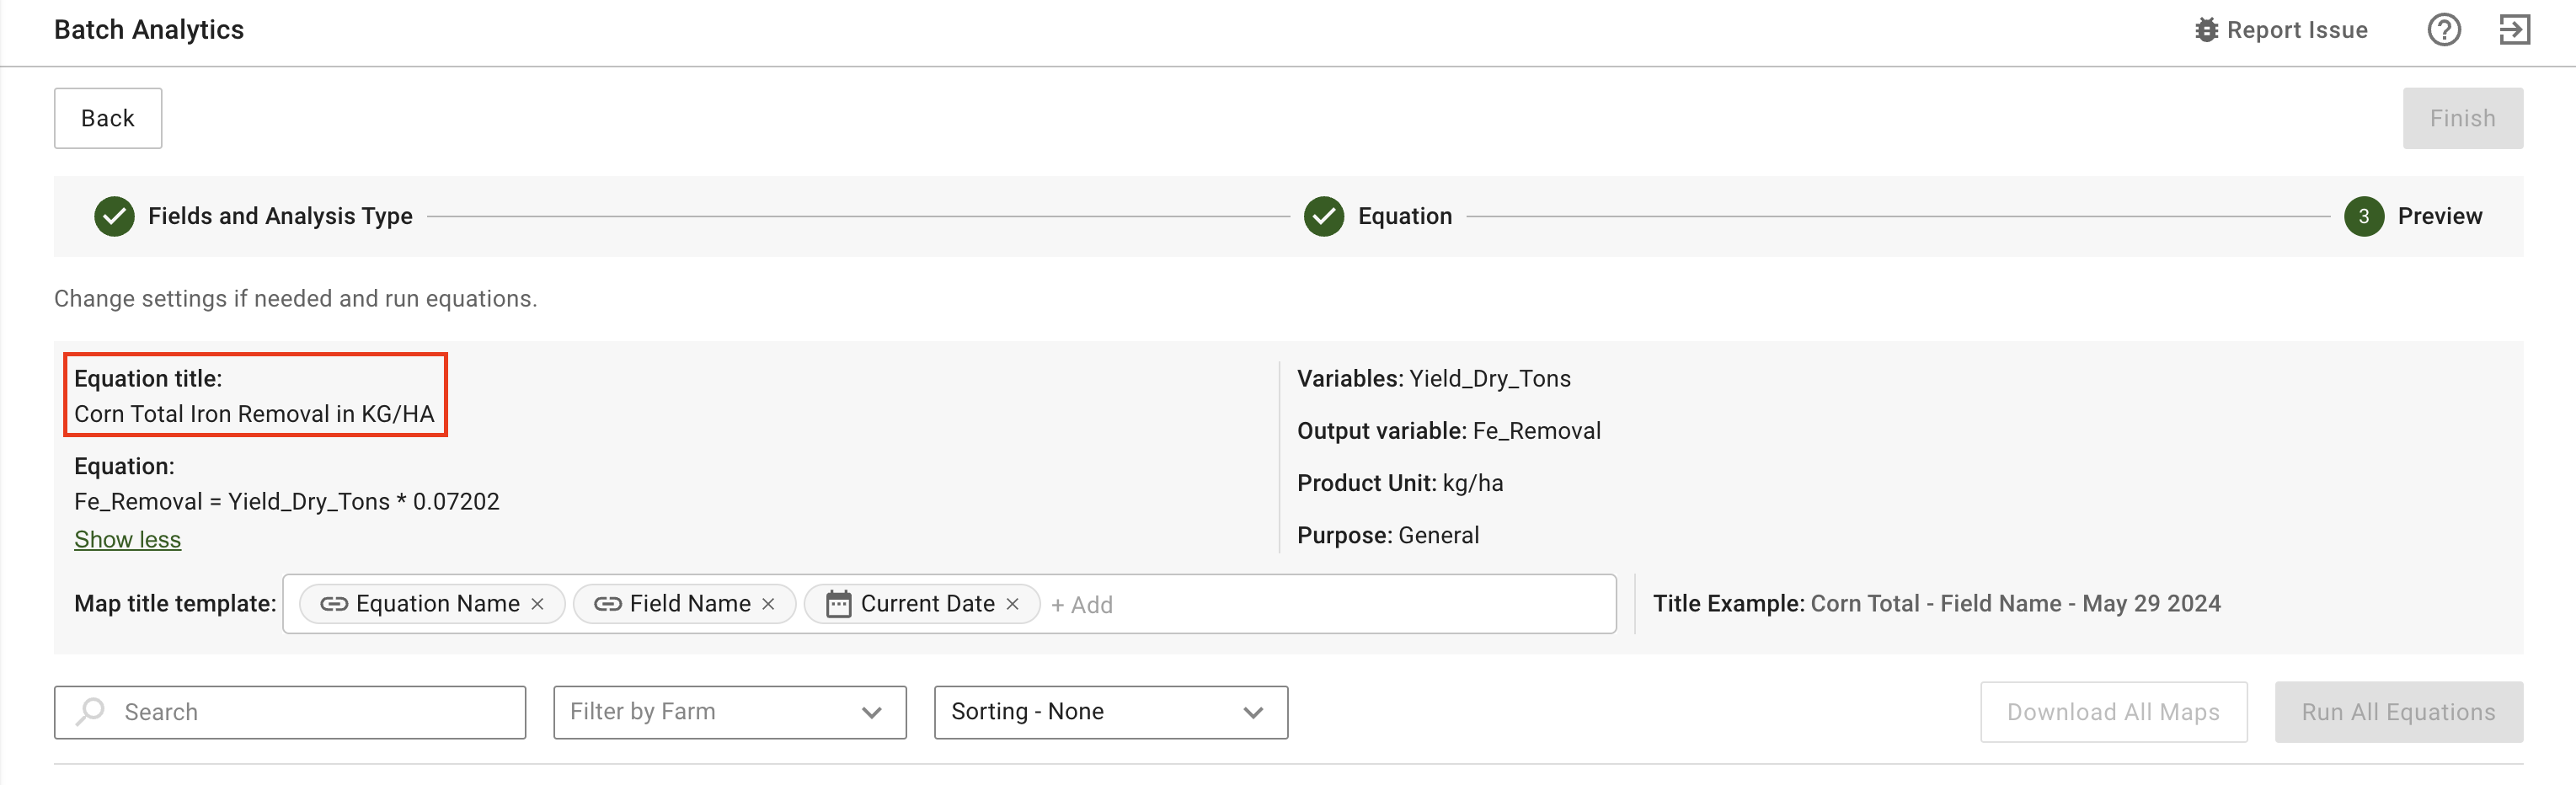
Equation Title in Batch Equation Maps Flow - expanded

Clickable Attributes in Field Assets Tree View

Enhanced Back Button Navigation on Zones Map Page
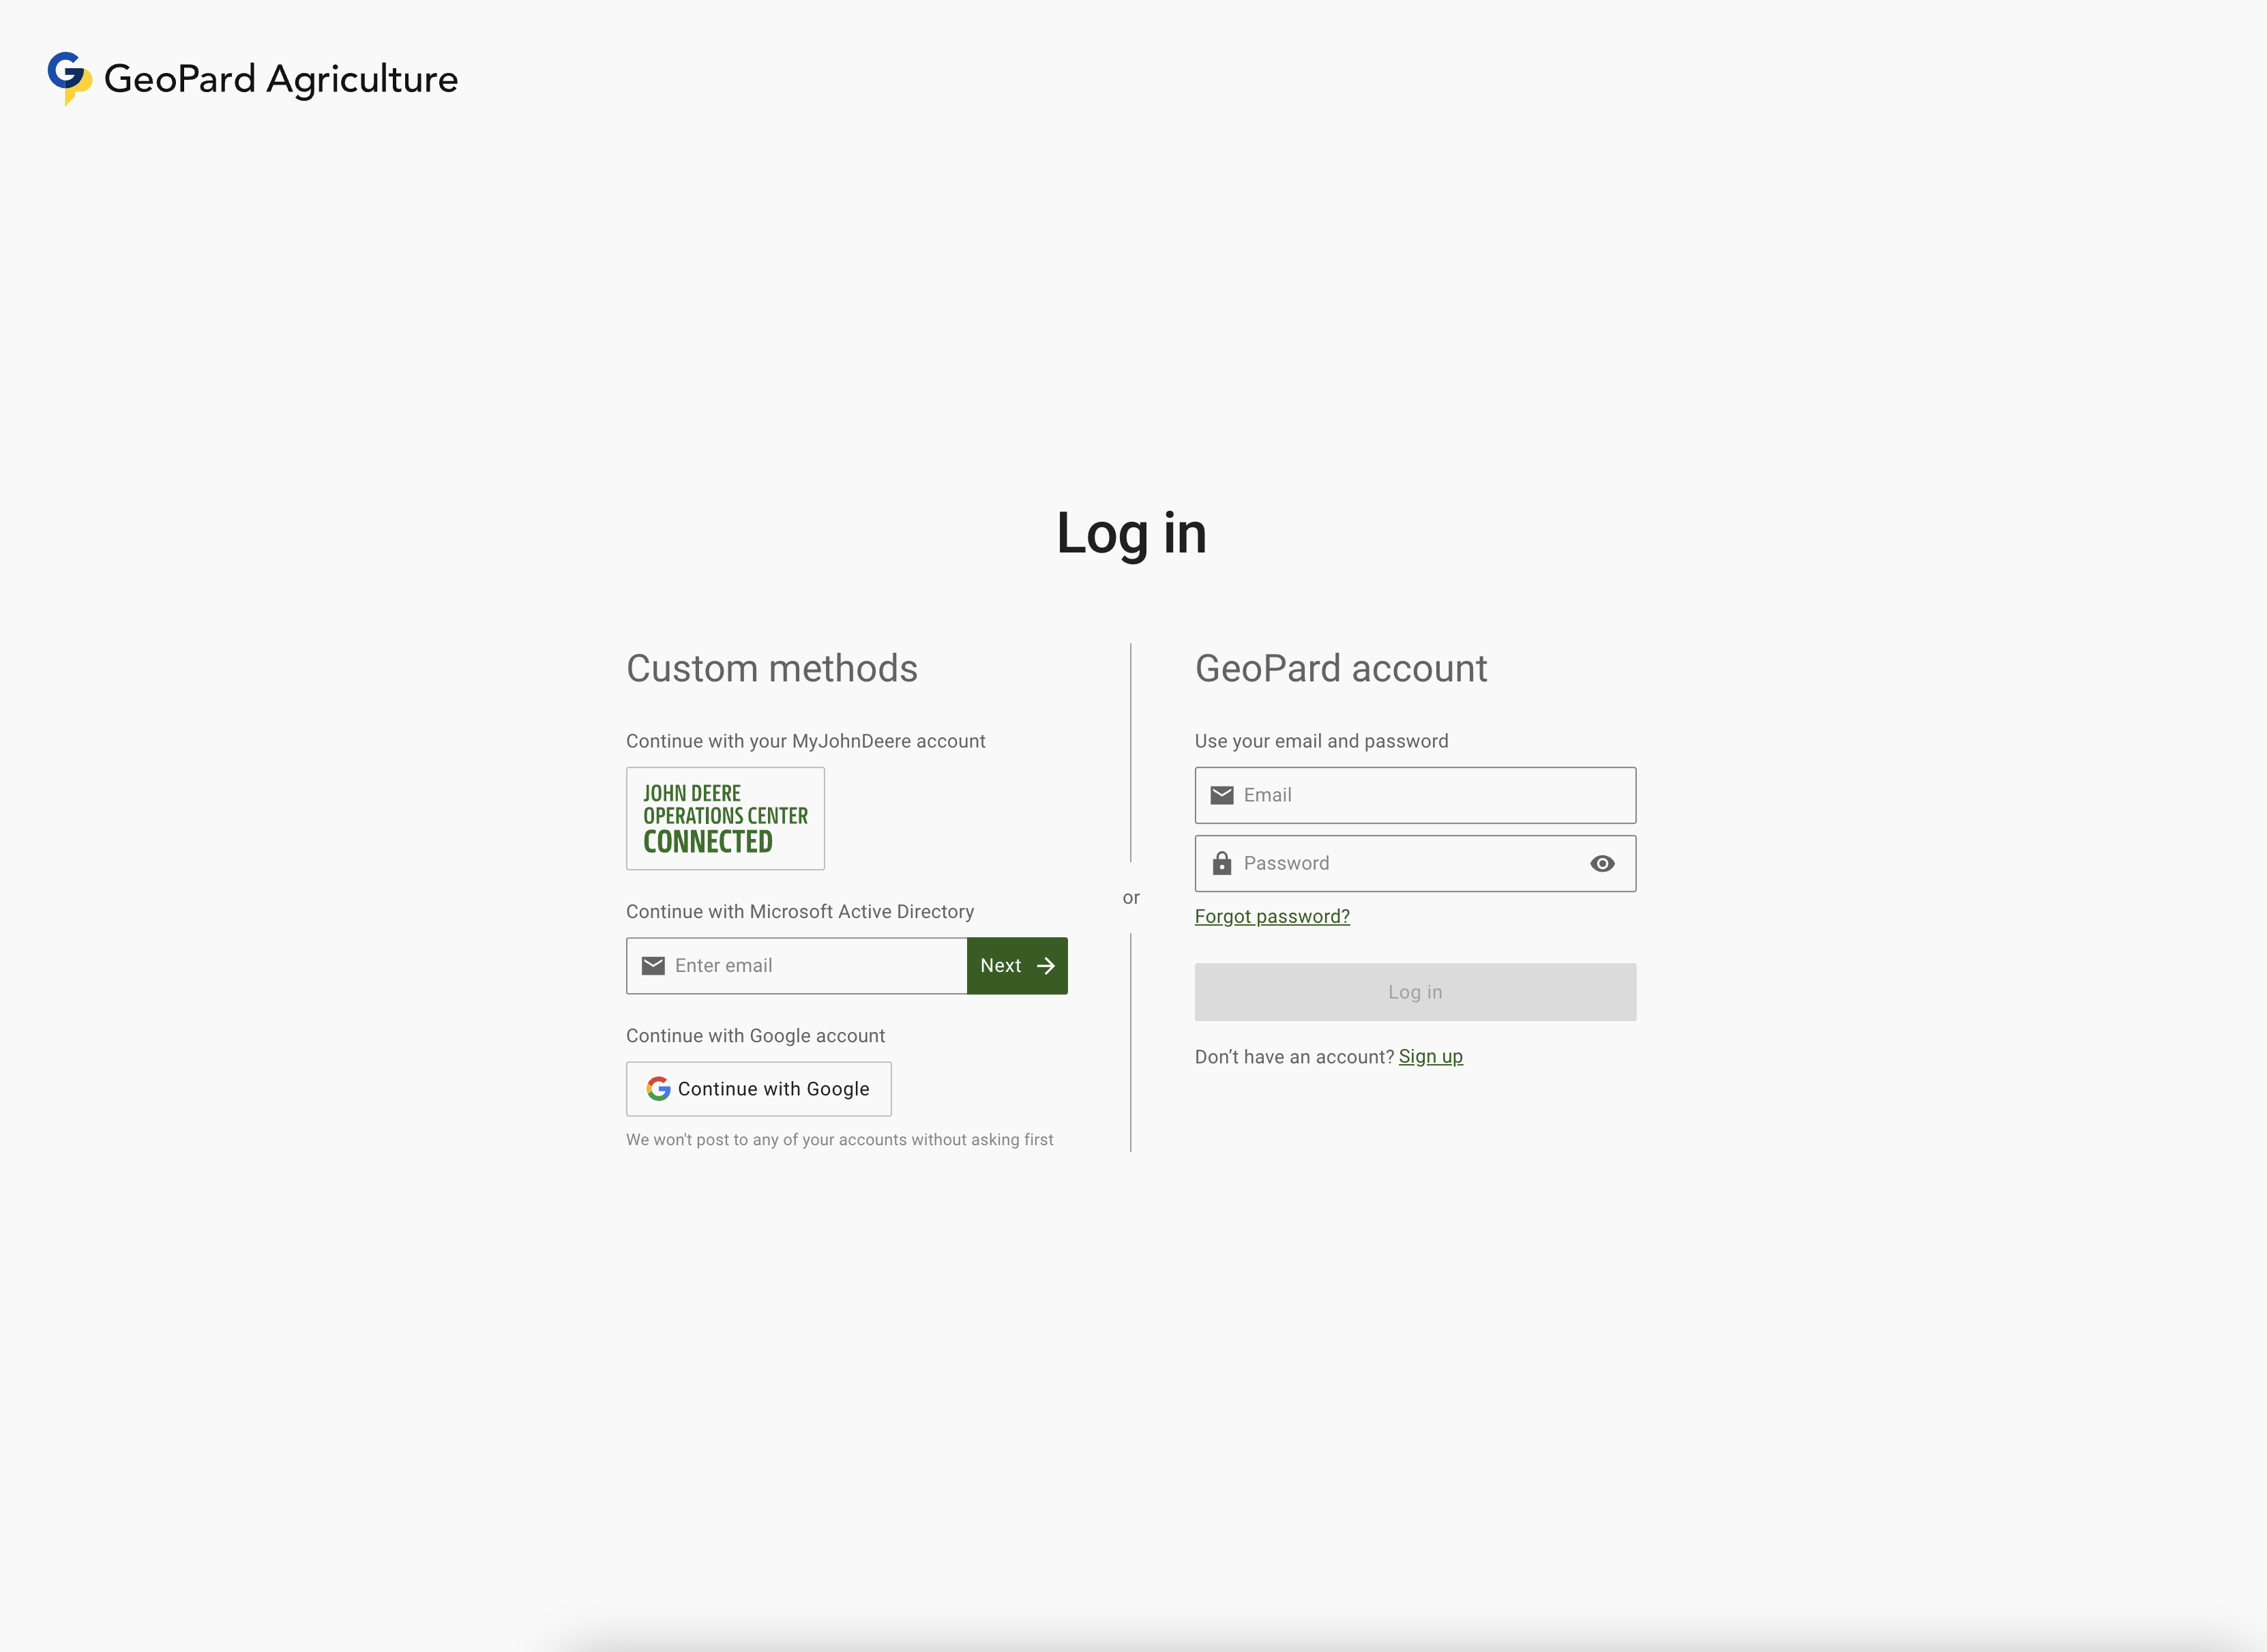
Improved Controls on Log In / Sign Up Pages
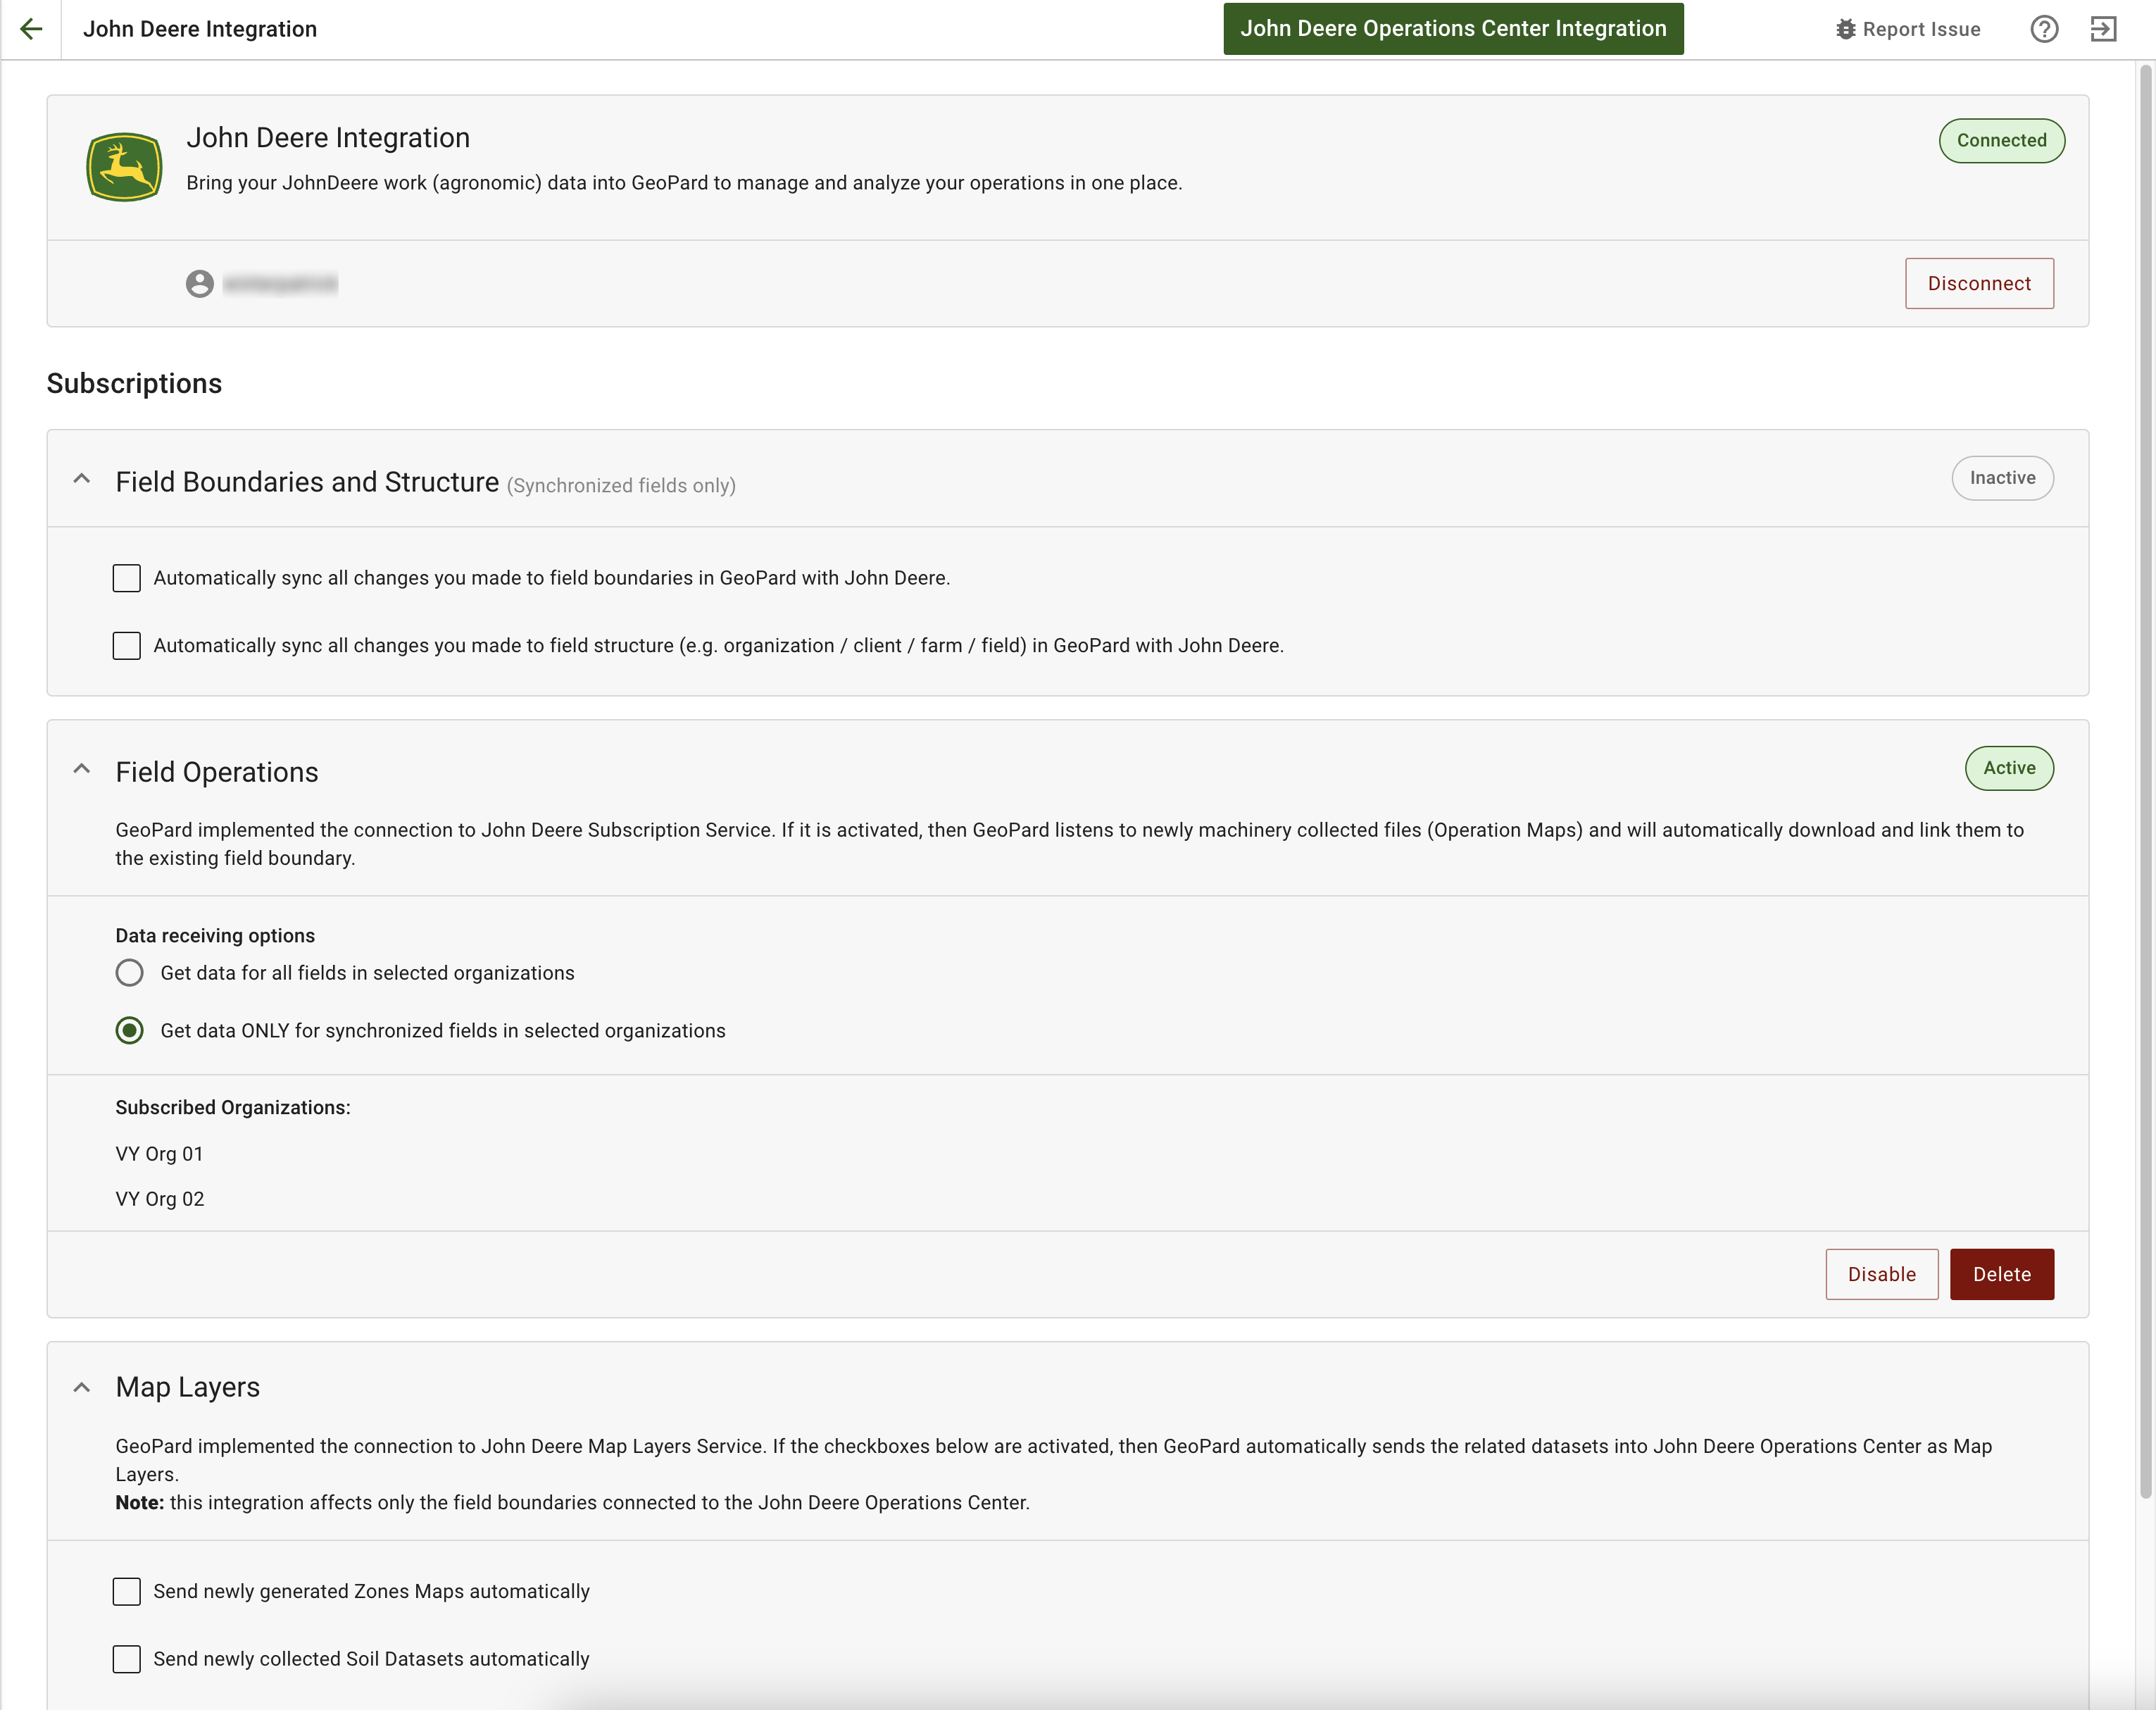
Expanded Sections on John Deere Integration Page