> For the complete documentation index, see [llms.txt](https://docs.geopard.tech/geopard-tutorials/llms.txt). Markdown versions of documentation pages are available by appending `.md` to page URLs; this page is available as [Markdown](https://docs.geopard.tech/geopard-tutorials/tr/urun-turu-web-uygulamasi/zones-maps-and-analytics/create-a-zones-map-using-a-template.md).
# Bir Şablon Kullanarak Bölgeler Haritası Oluştur
Tarlalar arasında yönetim bölgesi oluşturmayı standartlaştırmak için kaydedilmiş bir bölgeler şablonunu yeniden kullanın.
Mevcut bir Bölgeler Haritası’nın verileri ve ayarlarından yeni bir harita oluşturup ardından yeni veriler eklemek istediğinizde, Bölgeler Haritası şablonu kullanmak faydalıdır. Örneğin, 3 yıllık uydu verilerine dayanan bir Bölgeler Haritanız olabilir ve bölge sayısını ve bitki örtüsü indeksini aynı tutarak içinde bulunulan yıldan yeni bir görüntü eklemek isteyebilirsiniz.
İşlem, yeni bir Bölgeler Haritası oluşturma işlemiyle aynıdır; ancak bu kez başlangıç noktası olarak mevcut bir Bölgeler Haritası kullanılır.
1. Ağaç görünümünden tarlayı seçin ve **Bölgeler Haritası Oluştur** düğmesine tıklayın, **Mevcut bir Bölgeler Haritasını kopyala**seçeneğini belirleyin ve ardından **İleri**.
2. Sonraki adımda şablon olarak kullanmak istediğiniz bölgeler haritasını seçin. Tıklayın: **İleri**.
3. Aynı indeks kullanılarak aynı ölçütler uygulanır. Şablon analizinde kullanılan önceden seçilmiş görüntüleri görürsünüz. Burada eklemek veya değiştirmek istediğiniz görüntüyü (görüntüleri) seçebilirsiniz.
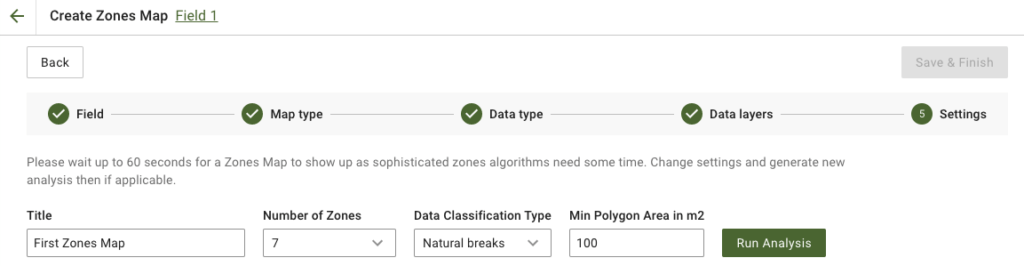
4. Sonraki adımda başlığı düzenleyebilir, bölge sayısını değiştirebilir, [bir Veri Sınıflandırma Türü seçebilir](https://docs.geopard.tech/geopard-tutorials/tr/urun-turu-web-uygulamasi/zones-maps-and-analytics/using-data-classification.md)ve Minimum Poligon Alanını metrekare cinsinden belirleyebilirsiniz. Devam etmek için **Analizi Çalıştır** düğmesine tıklayın.
Belirttiğiniz parametrelere bağlı olarak analizin çalışması 60 saniyeye kadar sürebilir.
5. İşlem tamamlandığında **Kaydet ve Bitir**.
Kaydedildikten sonra aşağıdaki mesajı görürsünüz:
Başka bir bölgeler haritası oluşturabilir, uygulama oranları atayabilir veya az önce oluşturduğunuz Bölgeler Haritası’nı açabilirsiniz.
---
# Agent Instructions
This documentation is published with GitBook. GitBook is the documentation platform designed so that both humans and AI agents can read, navigate, and reason over technical content effectively. Learn more at gitbook.com.
## Querying This Documentation
If you need additional information that is not directly available in this page, you can query the documentation by asking a question.
Perform an HTTP GET request on the following URL with the `ask` and `goal` query parameters:
```
GET https://docs.geopard.tech/geopard-tutorials/tr/urun-turu-web-uygulamasi/zones-maps-and-analytics/create-a-zones-map-using-a-template.md?ask=&goal=
```
`ask` is the immediate question: it should be specific, self-contained, and written in natural language.
`goal` is what the user is ultimately trying to achieve, the reason they need the answer. Sharing it helps GitBook give you a better, more relevant answer. A goal is most helpful when it describes the outcome the user wants rather than restating the question. For example, with `ask=how do I create an API token`, a goal like `automate deployments from our CI pipeline` lets GitBook tailor the answer to that use case.
The response will contain a direct answer to the question and relevant excerpts and sources from the documentation.
Use this mechanism when the answer is not explicitly present in the current page, you need clarification or additional context, or you want to retrieve related documentation sections.