> For the complete documentation index, see [llms.txt](https://docs.geopard.tech/geopard-tutorials/llms.txt). Markdown versions of documentation pages are available by appending `.md` to page URLs; this page is available as [Markdown](https://docs.geopard.tech/geopard-tutorials/swe/api-dokumentation/oversikt-over-geopard-api-anrop/87.-mutation-spara-anpassad-vectoranalysismap-zonesmap.md).
# 87. Mutation: Spara anpassad VectorAnalysisMap (ZonesMap)
Nedan finns detaljer om hur man sparar en anpassad ZonesMap med ett eget färgschema.
### 1. Spara ZonesMap-geometrier
{% hint style="danger" %}
VectorAnalysisMap (ZonesMap) `zonesMapGeojson` attributet måste vara i WGS84 (EPSG:4326) projektion och följa GeoJson [specifikation](https://geojson.org/).
Det förväntade `geojson` typen är `FeatureCollection` med `MultiPolygon`.
{% endhint %}
Mutation `saveVectorAnalysisMap` översikt:
* Attributet `fieldUuid` är en länkning till det befintliga fältet.
* Attributet `namn` beskriver namnet på ZonesMap.
* Attributtypen är ett enum-värde som representerar operationstypen. Det kan vara vilket värde som helst från `GENERAL` , `SPRAYING`, `SEEDING`, `FERTILIZING` eller `IRRIGATION`. Det är valfritt.
* Nyckelattributet med alla detaljer inklusive doser för VRA är `zonesMapGeojson` som en escapad JSON-sträng.
* Zonnumret anges i `properties` >> `zone`.
* Doser kommer att införlivas i `properties` >> `attributes`.
Det `properties` attributet är ett JSON-objekt som utökas med `zone`, `rates`, `ratesHeaders`, `ratesPrices` och `ratesUnits` detaljer. \
En förklaring av hur man anger doser är [HÄR](/geopard-tutorials/swe/api-dokumentation/oversikt-over-geopard-api-anrop/85.-mutation-tilldela-satser-till-vectoranalysismap-zonesmap.md).
{% code overflow="wrap" lineNumbers="true" %}
```json
{
\"zone\":1,
\"attributes\":{
\"rates\":[100],
\"ratesHeaders\":[\"Product1\"],
\"ratesPrices\":[0],
\"ratesUnits\":[\"KG_HA\"]
}
}
```
{% endcode %}
Exempel på mutation utan definierade doser:
{% code overflow="wrap" lineNumbers="true" %}
```graphql
mutation saveVectorAnalysisMap {
saveVectorAnalysisMap(
input: {
fieldUuid:"abef3a63-a64b-4d84-aab0-43eaa8fbe0cd"
name:"Custom Zones"
zonesMapGeojson:"{\"type\":\"FeatureCollection\",\"features\":[{\"type\":\"Feature\",\"properties\":{\"zone\":1,\"attributes\":{}},\"geometry\":{\"type\":\"MultiPolygon\",\"coordinates\":[[[[10.426584494429108,52.872847225483895],[10.426789204309529,52.87282914352929],[10.42676923261385,52.87256092698456],[10.42679456306152,52.87240585041315],[10.427391783218683,52.87195386627311],[10.427338425939524,52.872087776901424],[10.427073800972806,52.87238914697767],[10.426899048635903,52.872624214183844],[10.42701887880915,52.872889416681545],[10.427403333950082,52.87288037571423],[10.427498199505067,52.872940648795804],[10.427403333950082,52.8731003720562],[10.42777780324397,52.873242012946434],[10.428022456514952,52.87323297205208],[10.428167251308338,52.8731244811766],[10.42807737867767,52.87286832108788],[10.42809735037332,52.87259407743369],[10.428501777209902,52.872404215426826],[10.428611621536277,52.87250969442229],[10.42882132434022,52.87257900905101],[10.429100928079123,52.87232585943539],[10.429155850242694,52.87216914702836],[10.429205779481066,52.87184065187668],[10.429263945397143,52.87180554285836],[10.42928833,52.87242022],[10.42922193,52.8725049],[10.42915175626986,52.87255993568499],[10.429021041297204,52.872554899627374],[10.428771395100966,52.872708596972984],[10.42838693996012,52.872847225483895],[10.428257123938948,52.87296777165494],[10.428370342208543,52.873172781233286],[10.42795711,52.87349687],[10.42718139841625,52.87321758481732],[10.427228581614003,52.87319078118864],[10.427208609918353,52.87305516741958],[10.42683913354881,52.873015990029785],[10.426664381211879,52.87293763514347],[10.426584494429108,52.872847225483895]]],[[[10.427804124872603,52.871641800637654],[10.42875584,52.87092153],[10.42897875,52.87105982],[10.42921404,52.87137376],[10.429231472601687,52.87152239994234],[10.428951140362273,52.871638731603355],[10.42879635972102,52.87193709107814],[10.428666543698995,52.872057639778546],[10.428371961188788,52.872057639778546],[10.42821218762407,52.87183161069021],[10.427967534352206,52.871708047624395],[10.427804124872603,52.871641800637654]]]]}},{\"type\":\"Feature\",\"properties\":{\"zone\":2,\"attributes\":{}},\"geometry\":{\"type\":\"MultiPolygon\",\"coordinates\":[[[[10.426899048635903,52.872624214183844],[10.427073800972806,52.87238914697767],[10.427338425939524,52.872087776901424],[10.427391783218683,52.87195386627311],[10.427804124872603,52.871641800637654],[10.427967534352206,52.871708047624395],[10.42821218762407,52.87183161069021],[10.428371961188788,52.872057639778546],[10.428666543698995,52.872057639778546],[10.42879635972102,52.87193709107814],[10.428951140362273,52.871638731603355],[10.429231472601687,52.87152239994234],[10.42926357,52.87179608],[10.429263945397143,52.87180554285836],[10.429205779481066,52.87184065187668],[10.429155850242694,52.87216914702836],[10.429100928079123,52.87232585943539],[10.42882132434022,52.87257900905101],[10.428611621536277,52.87250969442229],[10.428501777209902,52.872404215426826],[10.42809735037332,52.87259407743369],[10.42807737867767,52.87286832108788],[10.428167251308338,52.8731244811766],[10.428022456514952,52.87323297205208],[10.42777780324397,52.873242012946434],[10.427403333950082,52.8731003720562],[10.427498199505067,52.872940648795804],[10.427403333950082,52.87288037571423],[10.42701887880915,52.872889416681545],[10.426899048635903,52.872624214183844]]]]}},{\"type\":\"Feature\",\"properties\":{\"zone\":3,\"attributes\":{}},\"geometry\":{\"type\":\"MultiPolygon\",\"coordinates\":[[[[10.428257123938948,52.87296777165494],[10.42838693996012,52.872847225483895],[10.428771395100966,52.872708596972984],[10.429021041297204,52.872554899627374],[10.42915175626986,52.87255993568499],[10.428370342208543,52.873172781233286],[10.428257123938948,52.87296777165494]]],[[[10.42619246,52.87286153],[10.42679456306152,52.872405850413145],[10.42676923261385,52.87256092698456],[10.426789204309529,52.87282914352929],[10.426584494429108,52.872847225483895],[10.426664381211879,52.87293763514347],[10.42683913354881,52.873015990029785],[10.427208609918353,52.87305516741958],[10.427228581614003,52.87319078118864],[10.42718139841625,52.87321758481732],[10.42619246,52.87286153]]]]}}]}"
}
) {
uuid
}
}
```
{% endcode %}
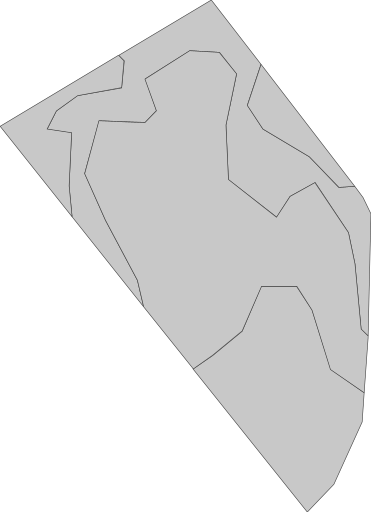
Standardrepresentation utan tilldelat färgschema ser ut så här. Användarens ZonesMap >> `geoMaps` >> `url` är lik [https://api.geopard.tech/geo/map/reflect?TRANSPARENT=true\&VIEWPARAMS=uuid:4a3929a5-c166-41d7-b547-da1511a9fa1d\&LAYERS=custom\_zone\_map\_view\&SRS=EPSG:3857\&STYLES=default\_zonesmap\&HEIGHT=64\&BBOX=1160638.4354309493,6959157.496681602,1160983.0667152018,6959632.459385279\&geopardApiKey=\](https://api.geopard.tech/geo/map/reflect?TRANSPARENT=true\&VIEWPARAMS=uuid:4a3929a5-c166-41d7-b547-da1511a9fa1d\&LAYERS=custom_zone_map_view\&SRS=EPSG:3857\&STYLES=default_zonesmap\&HEIGHT=64\&BBOX=1160638.4354309493,6959157.496681602,1160983.0667152018,6959632.459385279\&geopardApiKey=).
### 2. Tilldela anpassat färgschema
Mutation `setGeoMaps` översikt:
* Attributet `fieldUuid` är en länkning till det befintliga fältet.
* Attributet `vectorAnalysisMapUuid` är en länkning till den nyss sparade ZonesMap (VectorAnalysisMap) från första steget.
* Attributet `kortNamn` beskriver stilen som ska ändras. \
Alternativ för ZonesMap är `zones` och `miniatyrbild`.
* Attributet `hexColorCodes` beskriver hex-färgkoderna som ska anges.
{% hint style="danger" %}
Antalet färger i `hexColorCodes` måste motsvara exakt antalet befintliga zoner`.`
{% endhint %}
En förklaring av hur man sparar anpassade färger är [HÄR](/geopard-tutorials/swe/api-dokumentation/oversikt-over-geopard-api-anrop/39.-mutation-satt-egna-fargscheman-for-valda-geomaps.md) och hur man tillämpar anpassade färger direkt är [HÄR](/geopard-tutorials/swe/api-dokumentation/geo-endpoints-for-atkomst-till-spatial-data/wms-hamta-rasterbilder-av-spatiala-datalager/6.-zonesmap-anpassat-fargschema.md).
Exempel på mutation:
{% code overflow="wrap" lineNumbers="true" %}
```graphql
mutation setGeoMaps{
setGeoMaps(
input: {
geoMaps:[
{
shortName:"zones"
fieldUuid:"abef3a63-a64b-4d84-aab0-43eaa8fbe0cd"
vectorAnalysisMapUuid:"9799e2eb-06d2-4a42-8f47-38655abf11e1"
hexColorCodes:[
"#ffffbf",
"#66bd63",
"#f46d43"
]
}, {
shortName:"thumbnail"
fieldUuid:"abef3a63-a64b-4d84-aab0-43eaa8fbe0cd"
vectorAnalysisMapUuid:"9799e2eb-06d2-4a42-8f47-38655abf11e1"
hexColorCodes:[
"#ffffbf",
"#66bd63",
"#f46d43"
]
}
]
}
) {
kortNamn
}
}
```
{% endcode %}
Som resultat blir den visuella representationen från ZonesMap >> `geoMaps` >> `url` liknande [https://api.geopard.tech/geo/map/reflect?TRANSPARENT=true\&VIEWPARAMS=uuid:9799e2eb-06d2-4a42-8f47-38655abf11e1\&LAYERS=custom\_zone\_map\_view\&SRS=EPSG:3857\&STYLES=default\_zonesmap\&HEIGHT=64\&BBOX=1160638.4354309493,6959157.496681602,1160983.0667152018,6959632.459385279\&env=c1:#ffffbf;c2:#66bd63;c3:#f46d43\&geopardApiKey=\](https://api.geopard.tech/geo/map/reflect?TRANSPARENT=true\&VIEWPARAMS=uuid:9799e2eb-06d2-4a42-8f47-38655abf11e1\&LAYERS=custom_zone_map_view\&SRS=EPSG:3857\&STYLES=default_zonesmap\&HEIGHT=64\&BBOX=1160638.4354309493,6959157.496681602,1160983.0667152018,6959632.459385279\&env=c1:#ffffbf;c2:#66bd63;c3:#f46d43\&geopardApiKey=) ser ut så.
---
# Agent Instructions
This documentation is published with GitBook. GitBook is the documentation platform designed so that both humans and AI agents can read, navigate, and reason over technical content effectively. Learn more at gitbook.com.
## Querying This Documentation
If you need additional information that is not directly available in this page, you can query the documentation by asking a question.
Perform an HTTP GET request on the following URL with the `ask` and `goal` query parameters:
```
GET https://docs.geopard.tech/geopard-tutorials/swe/api-dokumentation/oversikt-over-geopard-api-anrop/87.-mutation-spara-anpassad-vectoranalysismap-zonesmap.md?ask=&goal=
```
`ask` is the immediate question: it should be specific, self-contained, and written in natural language.
`goal` is what the user is ultimately trying to achieve, the reason they need the answer. Sharing it helps GitBook give you a better, more relevant answer. A goal is most helpful when it describes the outcome the user wants rather than restating the question. For example, with `ask=how do I create an API token`, a goal like `automate deployments from our CI pipeline` lets GitBook tailor the answer to that use case.
The response will contain a direct answer to the question and relevant excerpts and sources from the documentation.
Use this mechanism when the answer is not explicitly present in the current page, you need clarification or additional context, or you want to retrieve related documentation sections.