> For the complete documentation index, see [llms.txt](https://docs.geopard.tech/geopard-tutorials/llms.txt). Markdown versions of documentation pages are available by appending `.md` to page URLs; this page is available as [Markdown](https://docs.geopard.tech/geopard-tutorials/ru/obzor-produkta-veb-prilozhenie/karty-zon-i-analitika/koefficient-otnositelnoi-variacii.md).
# Коэффициент относительной вариации
Количественно оценивайте пространственную вариацию относительно среднего, чтобы сравнивать изменчивость между полями и наборами данных.
Выявление изменений, произошедших на поле за последние одну-две недели, или один-два месяца, или даже за пару лет, помогает получить представление о развитии культуры.
Относительный коэффициент вариации, или индекс относительной вариации, можно использовать для:
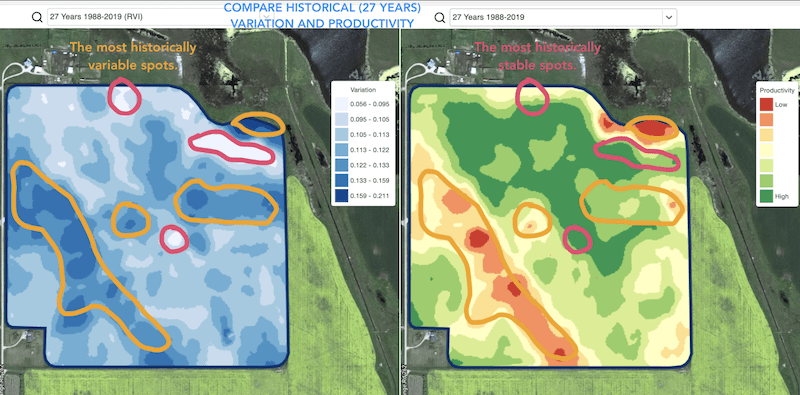
* находить участки с похожей продуктивностью за 5–10–20 лет и размещать опыты в зонах с похожими условиями, чтобы снизить вероятность ошибки
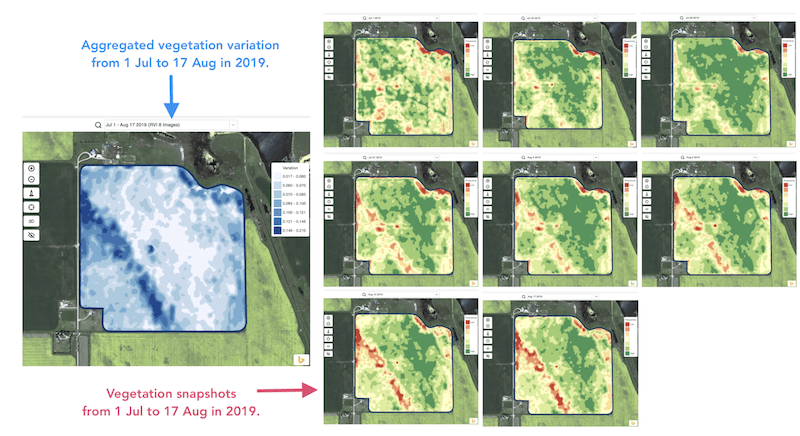
* отслеживать изменения в течение сезона и оценивать состояние посевов в процессе роста
* распознавать повреждённые участки после погодного бедствия, болезни или нашествия вредителей и рассчитывать площадь повреждений
* определять различие между двумя последними снимками и контролировать состояние посевов.
Индекс относительной вариации (RVI) от GeoPard охватывает все эти случаи и многие другие. RVI даст больше информации о развитии культуры при использовании вместе с сезонными и историческими управленческими зонами.
Просто выберите своё поле и спутниковые снимки, чтобы отслеживать изменения на нём и получать информацию по каждому участку вашего поля.
---
# Agent Instructions
This documentation is published with GitBook. GitBook is the documentation platform designed so that both humans and AI agents can read, navigate, and reason over technical content effectively. Learn more at gitbook.com.
## Querying This Documentation
If you need additional information that is not directly available in this page, you can query the documentation by asking a question.
Perform an HTTP GET request on the following URL with the `ask` and `goal` query parameters:
```
GET https://docs.geopard.tech/geopard-tutorials/ru/obzor-produkta-veb-prilozhenie/karty-zon-i-analitika/koefficient-otnositelnoi-variacii.md?ask=&goal=
```
`ask` is the immediate question: it should be specific, self-contained, and written in natural language.
`goal` is what the user is ultimately trying to achieve, the reason they need the answer. Sharing it helps GitBook give you a better, more relevant answer. A goal is most helpful when it describes the outcome the user wants rather than restating the question. For example, with `ask=how do I create an API token`, a goal like `automate deployments from our CI pipeline` lets GitBook tailor the answer to that use case.
The response will contain a direct answer to the question and relevant excerpts and sources from the documentation.
Use this mechanism when the answer is not explicitly present in the current page, you need clarification or additional context, or you want to retrieve related documentation sections.