> For the complete documentation index, see [llms.txt](https://docs.geopard.tech/geopard-tutorials/llms.txt). Markdown versions of documentation pages are available by appending `.md` to page URLs; this page is available as [Markdown](https://docs.geopard.tech/geopard-tutorials/pt-br/tour-do-produto-aplicativo-web/mapas-de-zonas-e-analises/criar-um-mapa-de-zonas-usando-imagens-de-satelite.md).
# Criar um Mapa de Zonas Usando Imagens de Satélite
Crie zonas de manejo a partir de imagens de satélite para identificar a variabilidade e orientar decisões de taxa variável.
1. Selecione o talhão na lista, clique no **Criar Mapa de Zonas** botão, selecione **Camada única**, e depois clique em **Avançar**.
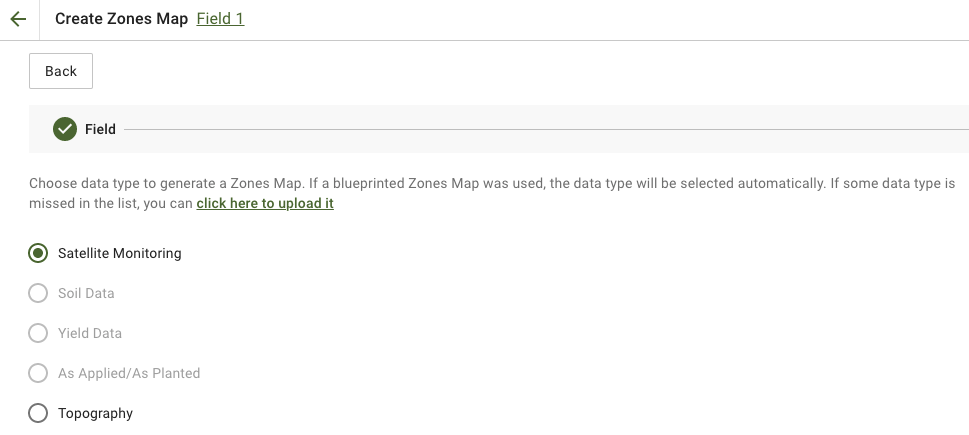
2. Selecionar **Monitoramento por Satélite** tipo de dado para prosseguir.
3. Na próxima etapa, você pode selecionar uma imagem de satélite. Você pode filtrar por mês, ano, fornecedor ou NDVI e alternar entre visualizações de imagem como NIR e EVI2. O **Aqui está uma breve descrição dos tipos de índices** link explica os índices disponíveis. Se você precisar alterar o índice, clique na seta ao lado de **EVI2**. Em seguida, clique **Avançar**.
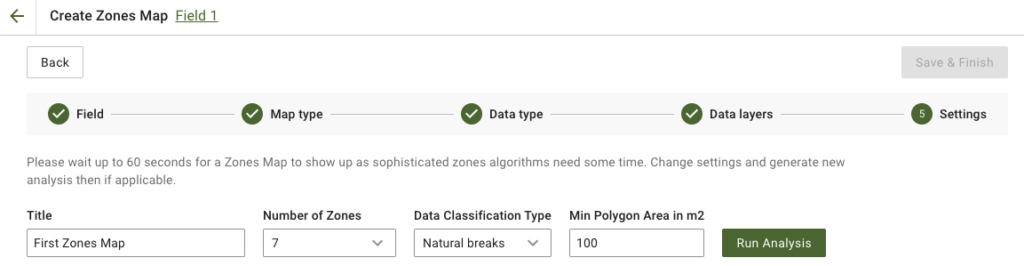
4. Na próxima etapa, você pode editar o título, alterar o número de zonas, [selecionar um Tipo de Classificação de Dados](/geopard-tutorials/pt-br/tour-do-produto-aplicativo-web/mapas-de-zonas-e-analises/usando-classificacao-de-dados.md), e definir a Área Mínima do Polígono em metros quadrados. Clique em **Executar Análise** para prosseguir.
A análise pode ser executada por até 60 segundos, dependendo dos parâmetros que você especificou.
5. Quando ela terminar, clique em **Salvar e Finalizar**.
Depois que for salvo, você verá a seguinte mensagem:
Você pode criar outro mapa de zonas, atribuir taxas ou abrir o Mapa de Zonas que acabou de criar. Se você o abrir, verá uma visualização semelhante.
---
# Agent Instructions
This documentation is published with GitBook. GitBook is the documentation platform designed so that both humans and AI agents can read, navigate, and reason over technical content effectively. Learn more at gitbook.com.
## Querying This Documentation
If you need additional information that is not directly available in this page, you can query the documentation by asking a question.
Perform an HTTP GET request on the following URL with the `ask` and `goal` query parameters:
```
GET https://docs.geopard.tech/geopard-tutorials/pt-br/tour-do-produto-aplicativo-web/mapas-de-zonas-e-analises/criar-um-mapa-de-zonas-usando-imagens-de-satelite.md?ask=&goal=
```
`ask` is the immediate question: it should be specific, self-contained, and written in natural language.
`goal` is what the user is ultimately trying to achieve, the reason they need the answer. Sharing it helps GitBook give you a better, more relevant answer. A goal is most helpful when it describes the outcome the user wants rather than restating the question. For example, with `ask=how do I create an API token`, a goal like `automate deployments from our CI pipeline` lets GitBook tailor the answer to that use case.
The response will contain a direct answer to the question and relevant excerpts and sources from the documentation.
Use this mechanism when the answer is not explicitly present in the current page, you need clarification or additional context, or you want to retrieve related documentation sections.