> For the complete documentation index, see [llms.txt](https://docs.geopard.tech/geopard-tutorials/llms.txt). Markdown versions of documentation pages are available by appending `.md` to page URLs; this page is available as [Markdown](https://docs.geopard.tech/geopard-tutorials/product-tour-web-app/zones-maps-and-analytics/create-a-zones-map-using-satellite-imagery.md).
# Create a Zones Map Using Satellite Imagery
1. Select the field in the list, click the **Create Zones Map** button, select **Single-layer**, and then click **Next**.
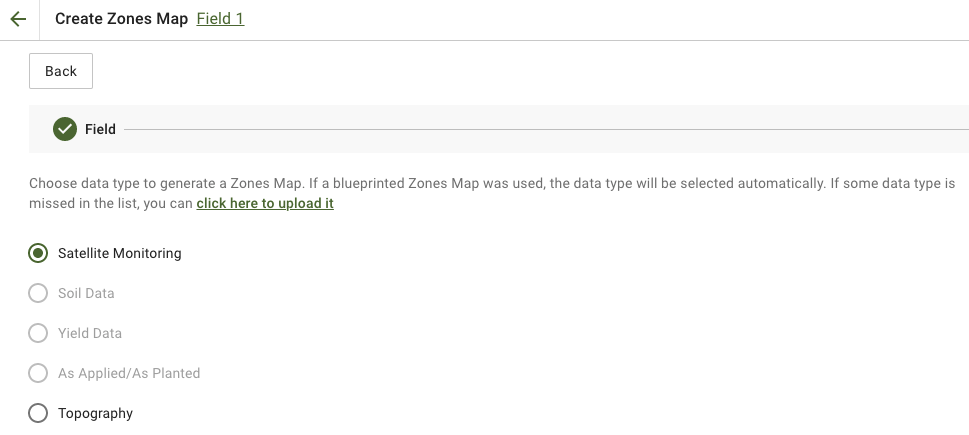
2. Select **Satellite Monitoring** data type to proceed.
3. In the next step, you can select a satellite image. You can filter by month, year, provider, or NDVI, and switch between image views such as NIR and EVI2. The **Here is a brief description of the indices types** link explains the available indices. If you need to change the index, click the arrow next to **EVI2**. Then click **Next**.
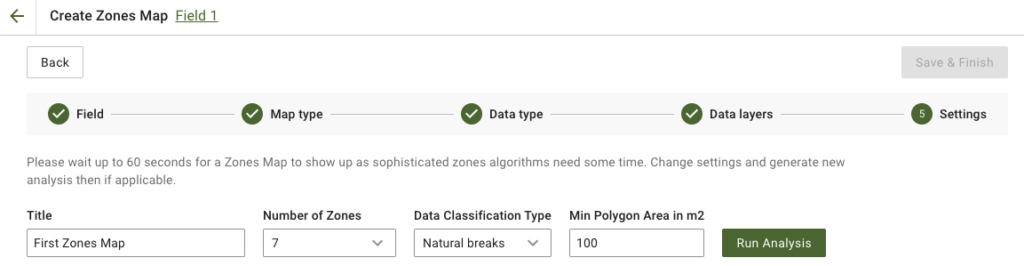
4. In the next step, you can edit the title, change the number of zones, [select a Data Classification Type](/geopard-tutorials/product-tour-web-app/zones-maps-and-analytics/using-data-classification.md), and define the Minimum Polygon Area in square meters. Click **Run Analysis** to proceed.
The analysis may run for up to 60 seconds, depending on the parameters you have specified.
5. Once it is finished, click **Save & Finish**.
After it is saved, you will see the following message:
You can create another zones map, assign rates, or open the Zones Map you just created. If you open it, you will see a similar view.
---
# Agent Instructions
This documentation is published with GitBook. GitBook is the documentation platform designed so that both humans and AI agents can read, navigate, and reason over technical content effectively. Learn more at gitbook.com.
## Querying This Documentation
If you need additional information that is not directly available in this page, you can query the documentation dynamically by asking a question.
Perform an HTTP GET request on the current page URL with the `ask` query parameter, and the optional `goal` query parameter:
```
GET https://docs.geopard.tech/geopard-tutorials/product-tour-web-app/zones-maps-and-analytics/create-a-zones-map-using-satellite-imagery.md?ask=&goal=
```
`ask` is the immediate question: it should be specific, self-contained, and written in natural language.
`goal` is optional and describes the broader end goal you are ultimately trying to accomplish on behalf of the user. GitBook uses it to tailor the answer towards what is most useful for that goal.
The response will contain a direct answer to the question and relevant excerpts and sources from the documentation.
Use this mechanism when the answer is not explicitly present in the current page, you need clarification or additional context, or you want to retrieve related documentation sections.