# Yield Data & Harvest Analytics

Use GeoPard to turn raw harvester files into decision-ready yield layers.

### Typical workflow

{% stepper %}
{% step %}

### Import

Bring in harvest data from shapefiles, machinery files, or John Deere. Start with file import. Then process, clean, calibrate, fill gaps, and reuse the result for agronomic recommendations.
{% endstep %}

{% step %}

### Process

Review attributes, units, field fit, and machine-specific details.
{% endstep %}

{% step %}

### Clean and calibrate

Remove noise. Fix striping. Align values to trusted totals.
{% endstep %}

{% step %}

### Restore gaps

Use synthetic yield where logging is missing or incomplete.
{% endstep %}

{% step %}

### Build recommendations

Create zones, equations, and profitability workflows from cleaned yield.
{% endstep %}

{% step %}

### Share outputs

Send yield-derived layers and recommendations to John Deere Ops Center.
{% endstep %}
{% endstepper %}

### 1. Import yield data

GeoPard supports standard GIS files and machinery formats.

Typical inputs include `shp`, `ISOXML`, and proprietary files such as `jdl`, `cn1`, `adm`, `dat`, and related machine archives.

You can also import yield directly from John Deere Operations Center.

<figure><img src="https://3272281156-files.gitbook.io/~/files/v0/b/gitbook-x-prod.appspot.com/o/spaces%2FYICBELdyAXXebKAzfLOR%2Fuploads%2FAyA8wGTgxwgAZsjOhlmz%2Fimage.png?alt=media&#x26;token=0aeed3da-5098-404c-a881-2025f690f4bd" alt="Upload machinery files"><figcaption><p>Upload machinery files and let GeoPard parse them into datasets.</p></figcaption></figure>

Use these pages for the exact flow:

* [Yield Data Import](https://docs.geopard.tech/geopard-tutorials/product-tour-web-app/import-precision-agriculture-data/yield-data-import)
* [Machinery Proprietary Formats](https://docs.geopard.tech/geopard-tutorials/product-tour-web-app/import-precision-agriculture-data/machinery-proprietary-formats)
* [Import from MyJohnDeere](https://docs.geopard.tech/geopard-tutorials/product-tour-web-app/import-precision-agriculture-data/import-from-myjohndeere)

### 2. Processing of yield data

After import, GeoPard links the dataset to the field and exposes its harvest attributes.

This is the stage to confirm that the dataset is usable.

Check these points first:

* main yield attribute is selected correctly
* units are correct and comparable
* moisture, speed, swath width, and heading look reasonable
* data fits the field boundary
* machine paths or harvest dates are available when needed

This review helps before any cleaning, zoning, or equation work.

{% hint style="info" %}
Yield datasets often contain more than one useful layer.

Besides yield mass, inspect moisture, dry matter, speed, distance, heading, and machine path behavior.
{% endhint %}

### 3. Cleaning and calibration

Raw yield files often include turns, stops, spikes, overlap, and values outside the field.

GeoPard cleans those artifacts and calibrates the dataset for later analysis.

<figure><img src="https://3272281156-files.gitbook.io/~/files/v0/b/gitbook-x-prod.appspot.com/o/spaces%2FYICBELdyAXXebKAzfLOR%2Fuploads%2F20oK9gntxkBPLitm5waW%2Fimage.png?alt=media&#x26;token=dc4dc121-6e5e-41cf-8d72-515fe882663a" alt="Result after cleaning and calibration"><figcaption><p>Result after cleaning and calibration.</p></figcaption></figure>

Use this when you need to:

* remove outliers and noise
* crop data by field boundary
* align multiple combines or harvest days
* correct global bias with known average or total yield
* apply USDA yield cleaning logic

Open the full guide here:

* [Yield Calibration & Cleaning](https://docs.geopard.tech/geopard-tutorials/agronomy/yield-calibration-and-cleaning)

{% hint style="warning" %}
Use **Pathwise calibration** when striping comes from multiple machines or days.

Use **Average or Total calibration** when the field total is trusted.
{% endhint %}

### 4. Synthetic yield maps

Not every harvest has complete yield logging.

Synthetic yield maps help when data is missing, partial, or never recorded.

<figure><img src="https://3272281156-files.gitbook.io/~/files/v0/b/gitbook-x-prod.appspot.com/o/spaces%2FYICBELdyAXXebKAzfLOR%2Fuploads%2FnEKqU70RiQEE0oxNKgls%2Fimage.png?alt=media&#x26;token=e779ea7e-dc6b-45d0-8be6-4f320a5d600a" alt="Calibrated vs synthetic yield"><figcaption><p>Compare calibrated yield with a synthetic yield map.</p></figcaption></figure>

<figure><img src="https://3272281156-files.gitbook.io/~/files/v0/b/gitbook-x-prod.appspot.com/o/spaces%2FYICBELdyAXXebKAzfLOR%2Fuploads%2Fz427malsrdHAQOCNjQyh%2Fimage.png?alt=media&#x26;token=26a63983-2a7f-48b2-bfc9-3e40a883582a" alt="Synthetic yield dataset example"><figcaption><p>Example of a synthetic yield dataset.</p></figcaption></figure>

This is useful when:

* older harvesters had no yield monitor
* only part of the field was logged
* raw data is too damaged to trust alone
* only average or total field yield is known

Synthetic yield uses historical field behavior and remote sensing patterns.

It also works for **partial restore**.

If one part of the field has usable harvest data and another part is missing or too noisy, GeoPard can reconstruct the incomplete area and build one more complete yield dataset.

<figure><img src="https://3272281156-files.gitbook.io/~/files/v0/b/gitbook-x-prod.appspot.com/o/spaces%2FYICBELdyAXXebKAzfLOR%2Fuploads%2F0seT3f3a7IV3lozI6BSj%2FGeoPard-restoring_partial_yield.gif?alt=media&#x26;token=1b6eecac-ac0a-45ff-80ee-26dd89da4a5a" alt="Reconstruct partial harvesting dataset"><figcaption><p>Reconstruct the missing part of a partial harvesting dataset.</p></figcaption></figure>

Read more:

* [Synthetic Yield Map](https://docs.geopard.tech/geopard-tutorials/agronomy/synthetic-yield-map)
* [Satellite Monitoring](https://docs.geopard.tech/geopard-tutorials/product-tour-web-app/satellite-monitoring)

### 5. Create recommendations from yield data

Clean yield data is one of the strongest inputs for prescriptions and post-season analytics.

#### Zones

Use yield alone or combine it with soil and as-applied layers.

This is a common route for productivity zones and variable-rate planning.

You can also build zoning from several yield datasets across years.

The common workflow is:

* clean and calibrate each yield dataset
* normalize or compare datasets from different years
* include synthetic yield where historical harvest logging is missing
* combine the selected yield layers into one zoning workflow

Useful pages:

* [Creating Zones Map using Soil/Yield/As Applied Data](https://docs.geopard.tech/geopard-tutorials/product-tour-web-app/zones-maps-and-analytics/create-a-zones-map-using-soil-yield-or-as-applied-data)
* [Field Management Zones (Productivity Zones) Creation Process](https://docs.geopard.tech/geopard-tutorials/agronomy/field-management-zones-productivity-zones-creation-process)
* [Comparing Yield Datasets](https://docs.geopard.tech/geopard-tutorials/agronomy/comparing-yield-datasets)

#### Equations

Use yield inside equations for removal, efficiency, ROI, similarity, and custom analytics.

* [Equation-based Analytics](https://docs.geopard.tech/geopard-tutorials/product-tour-web-app/equation-based-analytics)
* [Batch Equation analytics](https://docs.geopard.tech/geopard-tutorials/product-tour-web-app/equation-based-analytics/batch-equation-analytics)
* [Nitrogen Use Efficiency (NUE) & Nitrogen Uptake](https://docs.geopard.tech/geopard-tutorials/agronomy/nitrogen-use-efficiency-nue-and-nitrogen-uptake)

#### VRA maps based on nutrient uptake

Yield data can also support nutrient-removal and nutrient-uptake workflows.

One practical example is building a variable-rate nitrogen map from crop uptake logic, then exporting it as a machine-ready prescription.

<figure><img src="https://lh4.googleusercontent.com/GlMwn4wfmG_uCEh4YaAY7w8wMmZ-eqdVkS9y8gZr1GFxnS7SJX_oH7njtMadYROdlHRkmsqg69JEGGFl-m02gJhdipOKxaoyohJDuzo5lAdmsx3CEGc3jUbTgaakZZc1ZzL1IThM15urylg81hoYv3Fv_lfHK3Y3iYtNiOBMhEGBzKF_eoyV8QBcJQ" alt="Variable-rate nutrient uptake map example"><figcaption><p>
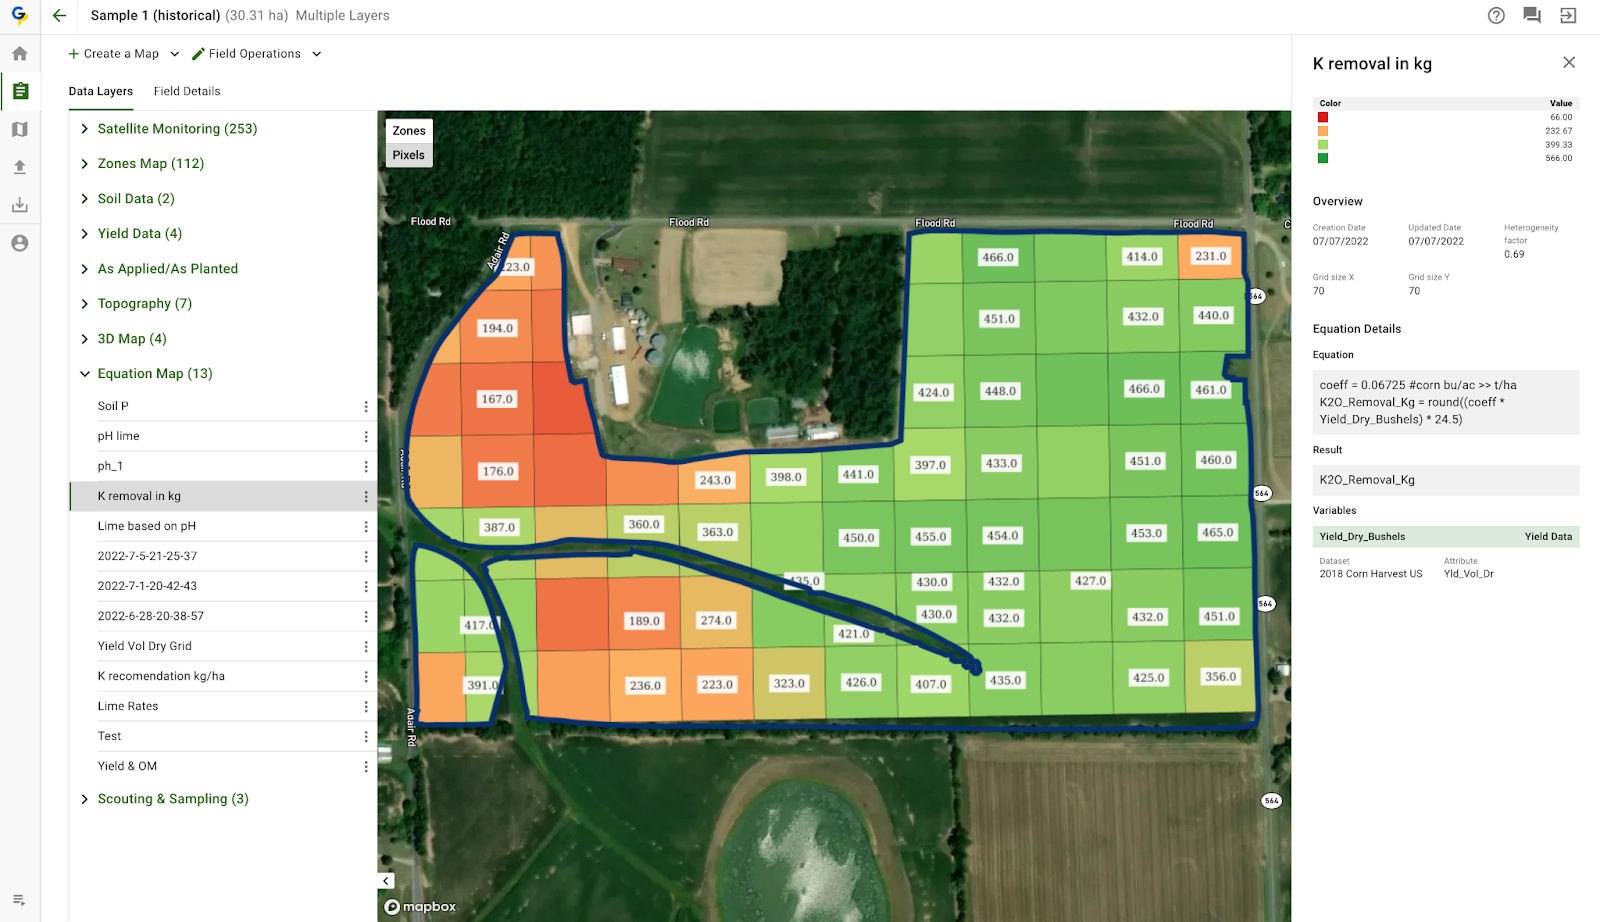
Example of a VRA map based on nutrient uptake derived from yield data.</p></figcaption></figure>

GeoPard can calculate:

* **Nitrogen Uptake (NU)**
* **Nitrogen Use Efficiency (NUE)**
* **Nitrogen Surplus (NS)**

These outputs help identify where the crop removed more nutrients, where nitrogen remained unused, and where next-season rates should shift up or down.

Use these references:

* [Nitrogen Use Efficiency (NUE) & Nitrogen Uptake](https://docs.geopard.tech/geopard-tutorials/agronomy/nitrogen-use-efficiency-nue-and-nitrogen-uptake)
* [Use Case: Variable-Rate Nitrogen (VRA) for Potatoes to Realize 5–10% More Yield](https://docs.geopard.tech/geopard-tutorials/agronomy/use-case-variable-rate-nitrogen-vra-for-potatoes-to-realize-5-10-more-yield)
* [Assign Variable Rates in the Zones (Ag inputs Rates Distribution Tool)](https://docs.geopard.tech/geopard-tutorials/product-tour-web-app/zones-maps-and-analytics/assign-variable-rates-in-zones-ag-input-rates-distribution-tool)

#### Profit maps

Profit-style workflows combine yield, prices, and operation costs.

Use them to see margin differences inside the same field, not just one field-average number.

In the Italy dealer workflow example, GeoPard compares yield and profitability by zone after VRA execution and harvest review.

Key takeaways from that example:

* **Zone 2** had the highest total profit and average yield.
* **Zone 3** reached the highest productivity with **20.42 t/ha**.
* **Zone 3** also delivered **€1808.14/ha** profitability.
* The profit map highlights where margin is strong and where costs are harder to recover.

<figure><img src="https://3272281156-files.gitbook.io/~/files/v0/b/gitbook-x-prod.appspot.com/o/spaces%2FYICBELdyAXXebKAzfLOR%2Fuploads%2F47XGTkAERSxGHMsIKxQ6%2F6.png?alt=media&#x26;token=557d812b-784f-4d33-a208-157ef4e6ac47" alt="Profit map with high and low margin areas"><figcaption><p>Profit map with high- and low-margin areas.</p></figcaption></figure>

References:

* [Dealer Workflow in Italy: John Deere Ops Center - GeoPard - VRA Nitrogen - Trials - Profit Maps](https://docs.geopard.tech/geopard-tutorials/agronomy/dealer-workflow-in-italy-john-deere-ops-center-geopard-vra-nitrogen-trials-profit-maps)
* [Introducing GeoPard's Profit Maps: A Step Forward in Precision Agriculture](https://geopard.tech/blog/introducing-geopards-profit-maps-a-step-forward-in-precision-agriculture/)

### 6. Send yield data to John Deere Ops Center

There are three practical routes.

First, import harvest data from John Deere into GeoPard.

Second, send yield-derived outputs back to John Deere as files or map layers.

Third, export processed yield back as **Operation data**.

Use the **Operation data** route when you want the cleaned or calibrated dataset to replace the dataset visible in John Deere Operations Center.

If the field is already linked with John Deere, new GeoPard assets on that field can sync back to Ops Center.

<figure><img src="https://3272281156-files.gitbook.io/~/files/v0/b/gitbook-x-prod.appspot.com/o/spaces%2FYICBELdyAXXebKAzfLOR%2Fuploads%2F8dKxPmUmV4amrPsHjVS2%2FExport%20GeoPard%20Layer%20to%20John%20Deere%20as%20a%20Map%20Layer.png?alt=media&#x26;token=97fa981e-9c01-4755-97ba-c30db4cb27ad" alt="Export layer to John Deere"><figcaption><p>Send GeoPard layers to John Deere Ops Center.</p></figcaption></figure>

Use these pages:

* [Import from MyJohnDeere](https://docs.geopard.tech/geopard-tutorials/product-tour-web-app/import-precision-agriculture-data/import-from-myjohndeere)
* [6. Export Rx Maps to John Deere Operations Center as Files](https://docs.geopard.tech/geopard-tutorials/product-tour-web-app/john-deere-operations-center-integration/6.-export-rx-maps-to-john-deere-operations-center-as-files)
* [9. Export Soil, Topography, Satellite or Analytics as Map Layers](https://docs.geopard.tech/geopard-tutorials/product-tour-web-app/john-deere-operations-center-integration/9.-export-soil-topography-satellite-or-analytics-as-map-layers)

{% hint style="info" %}
For John Deere-connected fields, GeoPard can also push processed layers back into Ops Center as operational data.

This is useful after yield cleaning and calibration, when the corrected dataset should replace the original operational layer in John Deere.
{% endhint %}

### Related pages

* [Comparing Yield Datasets](https://docs.geopard.tech/geopard-tutorials/agronomy/comparing-yield-datasets)
* [Viewing yield data](https://docs.geopard.tech/geopard-tutorials/product-tour-mobile-app/viewing-yield-data)
* [Operations Log - Track errors/Imports and Analytics](https://docs.geopard.tech/geopard-tutorials/product-tour-web-app/operations-log-track-errors-imports-and-analytics)
