> For the complete documentation index, see [llms.txt](https://docs.geopard.tech/geopard-tutorials/llms.txt). Markdown versions of documentation pages are available by appending `.md` to page URLs; this page is available as [Markdown](https://docs.geopard.tech/geopard-tutorials/nor/produktomvisning-nettapp/zones-maps-and-analytics/heterogeneity-factor.md).
# Heterogenitetsfaktor
Mål variasjonen innen skiftet for å identifisere skifter der soner og variable mengder gir mest verdi.
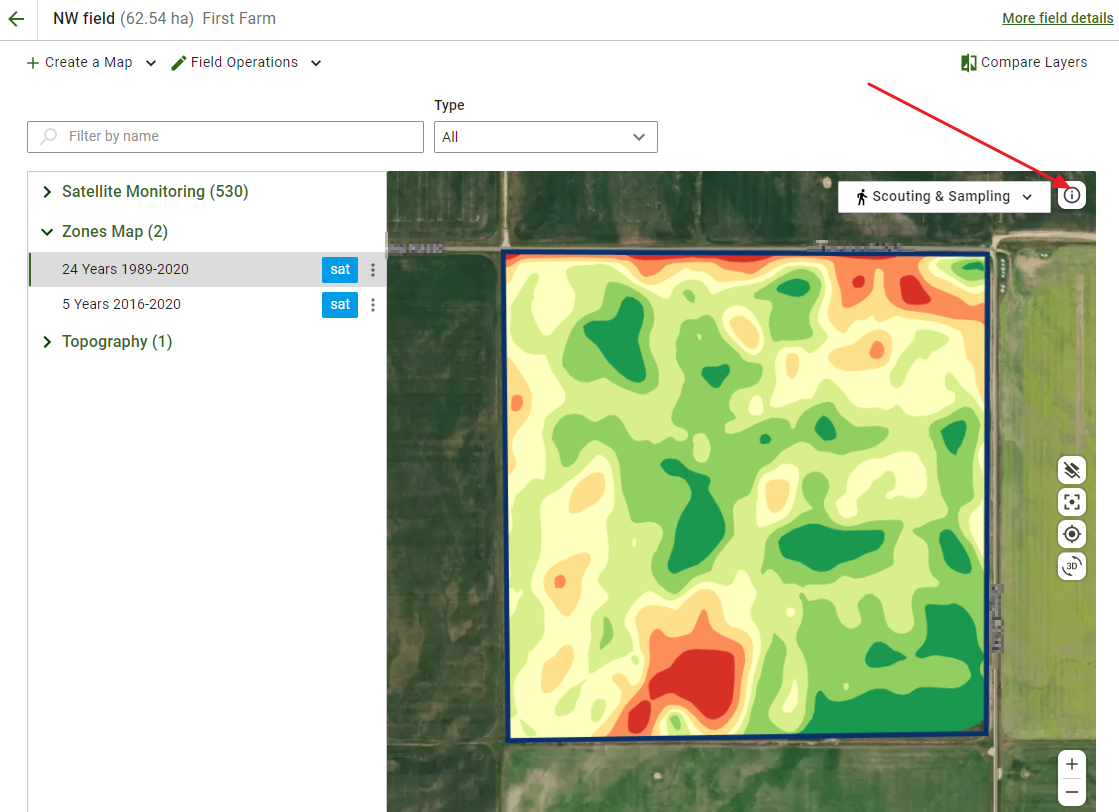
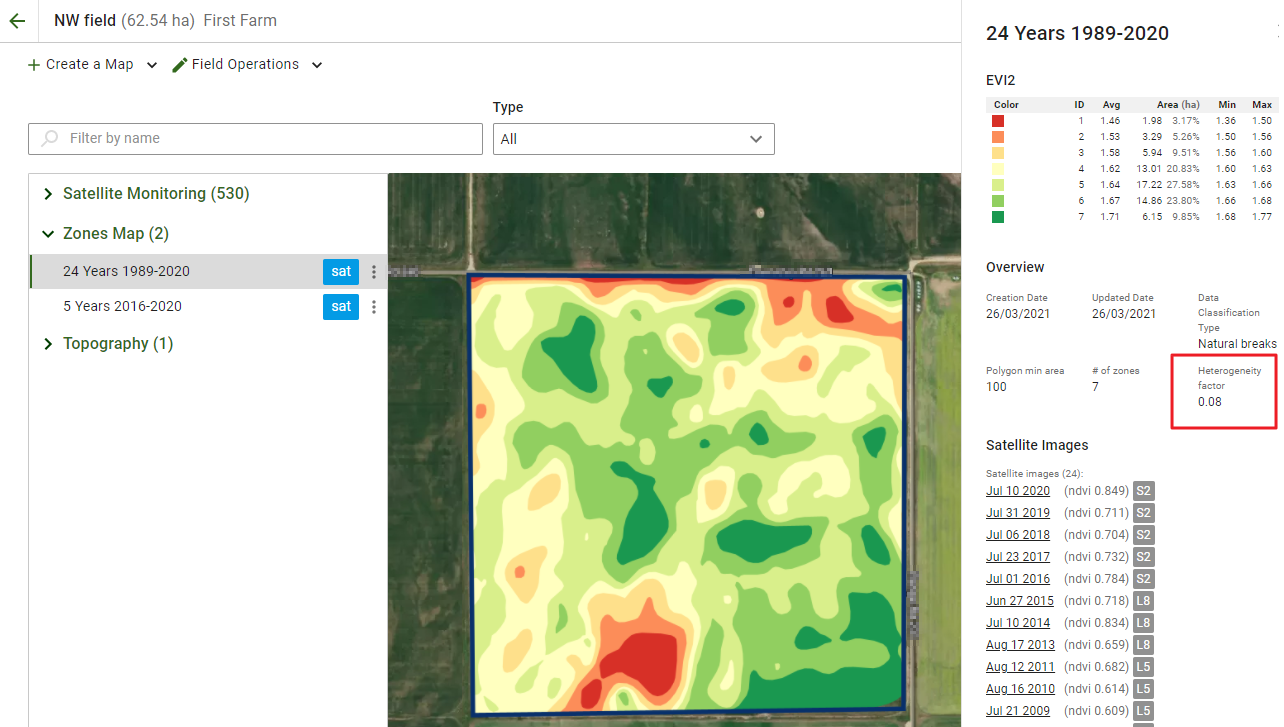
En av funksjonene GeoPard tilbyr, er en heterogenitetsfaktor for skiftene dine. Slik ser du den: Åpne skiftet du vil undersøke, velg sonekartet, og klikk på **Info** -ikonet på kartet. Da åpnes sidepanelet.
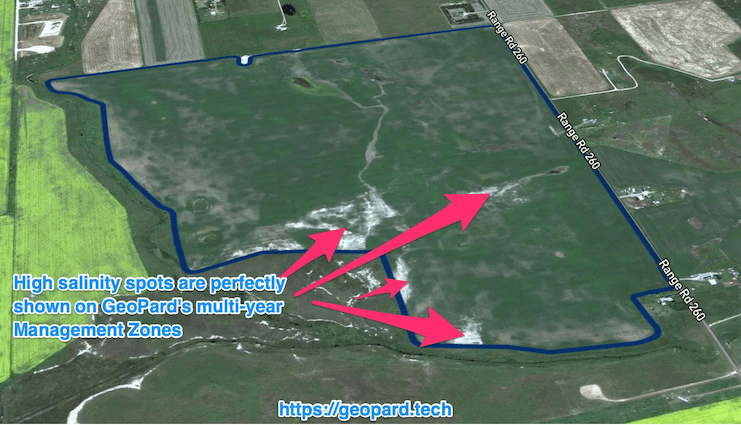
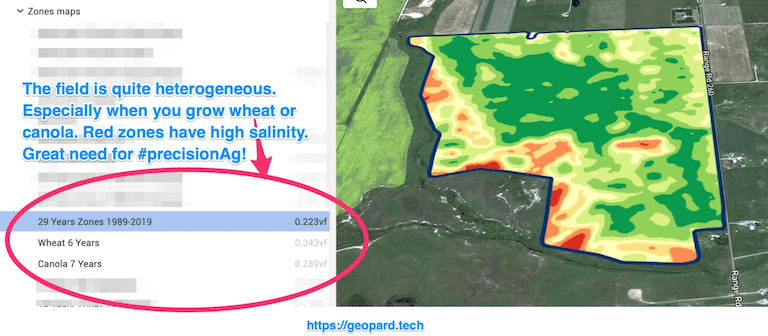
Heterogenitetsfaktoren viser hvor stor variasjon det er på skiftet. Jo større variasjon et skifte har, desto større er behovet for presisjonsjordbruksteknologi. Den er spesielt nyttig sammen med GeoPards flerårsanalyse (historikk for 30 år).
Hvis du har mange skifter, kan faktoren hjelpe deg med å finne ut hvilke skifter du først bør prioritere for [variabel tildeling](http://test/) (såing, gjødsling og sprøyting).
Ved å kombinere GeoPards heterogenitetsfaktor med flerårsanalyse kan du spare mest på innsatsmidler på skiftene med størst variasjon.
---
# Agent Instructions
This documentation is published with GitBook. GitBook is the documentation platform designed so that both humans and AI agents can read, navigate, and reason over technical content effectively. Learn more at gitbook.com.
## Querying This Documentation
If you need additional information that is not directly available in this page, you can query the documentation by asking a question.
Perform an HTTP GET request on the following URL with the `ask` and `goal` query parameters:
```
GET https://docs.geopard.tech/geopard-tutorials/nor/produktomvisning-nettapp/zones-maps-and-analytics/heterogeneity-factor.md?ask=&goal=
```
`ask` is the immediate question: it should be specific, self-contained, and written in natural language.
`goal` is what the user is ultimately trying to achieve, the reason they need the answer. Sharing it helps GitBook give you a better, more relevant answer. A goal is most helpful when it describes the outcome the user wants rather than restating the question. For example, with `ask=how do I create an API token`, a goal like `automate deployments from our CI pipeline` lets GitBook tailor the answer to that use case.
The response will contain a direct answer to the question and relevant excerpts and sources from the documentation.
Use this mechanism when the answer is not explicitly present in the current page, you need clarification or additional context, or you want to retrieve related documentation sections.