> For the complete documentation index, see [llms.txt](https://docs.geopard.tech/geopard-tutorials/llms.txt). Markdown versions of documentation pages are available by appending `.md` to page URLs; this page is available as [Markdown](https://docs.geopard.tech/geopard-tutorials/nl/producttour-webapp/zoneskaarten-en-analyses/een-zoneskaart-maken-met-satellietbeelden.md).
# Een zoneskaart maken met satellietbeelden
1. Selecteer het perceel in de lijst en klik op de **Zones-kaart maken** knop, selecteer **Enkele laag**, en klik vervolgens op **Volgende**.
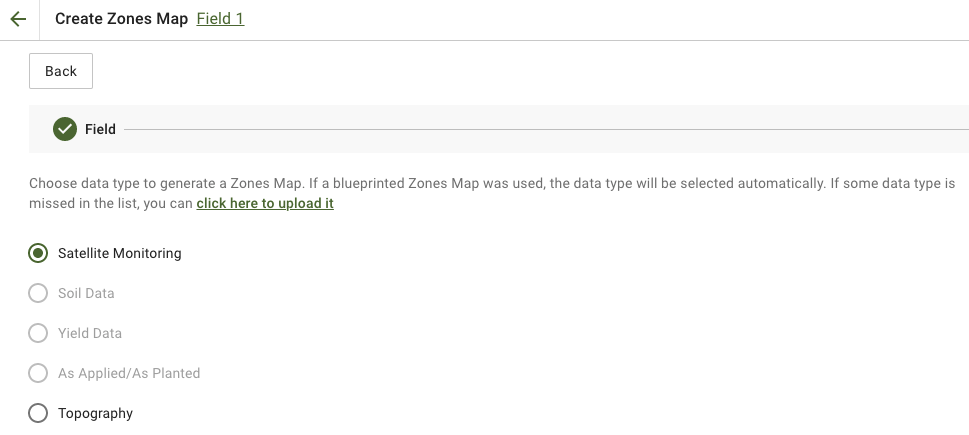
2. Selecteren **Satellietmonitoring** gegevenstype om door te gaan.
3. In de volgende stap kunt u een satellietafbeelding selecteren. U kunt filteren op maand, jaar, aanbieder of NDVI, en schakelen tussen beeldweergaven zoals NIR en EVI2. De **Hier is een korte beschrijving van de typen indices** link legt de beschikbare indices uit. Als u de index wilt wijzigen, klik dan op de pijl naast **EVI2**. Klik vervolgens op **Volgende**.
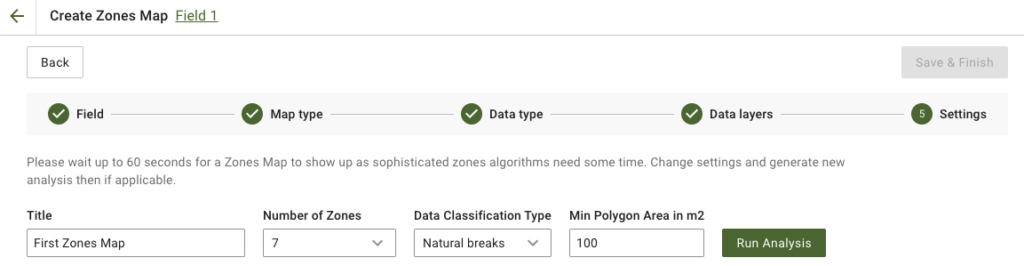
4. In de volgende stap kunt u de titel bewerken, het aantal zones wijzigen, [een type gegevensclassificatie selecteren](/geopard-tutorials/nl/producttour-webapp/zoneskaarten-en-analyses/met-gegevensclassificatie-werken.md), en het minimale polygoonoppervlak in vierkante meters definiëren. Klik op **Analyse uitvoeren** om verder te gaan.
De analyse kan, afhankelijk van de door u opgegeven parameters, tot 60 seconden duren.
5. Klik, zodra deze is voltooid, op **Opslaan en voltooien**.
Nadat het is opgeslagen, ziet u het volgende bericht:
U kunt nog een zones-kaart maken, tarieven toewijzen of de Zones-kaart openen die u zojuist hebt gemaakt. Als u deze opent, ziet u een vergelijkbare weergave.
---
# Agent Instructions
This documentation is published with GitBook. GitBook is the documentation platform designed so that both humans and AI agents can read, navigate, and reason over technical content effectively. Learn more at gitbook.com.
## Querying This Documentation
If you need additional information that is not directly available in this page, you can query the documentation dynamically by asking a question.
Perform an HTTP GET request on the current page URL with the `ask` query parameter, and the optional `goal` query parameter:
```
GET https://docs.geopard.tech/geopard-tutorials/nl/producttour-webapp/zoneskaarten-en-analyses/een-zoneskaart-maken-met-satellietbeelden.md?ask=&goal=
```
`ask` is the immediate question: it should be specific, self-contained, and written in natural language.
`goal` is optional and describes the broader end goal you are ultimately trying to accomplish on behalf of the user. GitBook uses it to tailor the answer towards what is most useful for that goal.
The response will contain a direct answer to the question and relevant excerpts and sources from the documentation.
Use this mechanism when the answer is not explicitly present in the current page, you need clarification or additional context, or you want to retrieve related documentation sections.