> For the complete documentation index, see [llms.txt](https://docs.geopard.tech/geopard-tutorials/llms.txt). Markdown versions of documentation pages are available by appending `.md` to page URLs; this page is available as [Markdown](https://docs.geopard.tech/geopard-tutorials/nl/producttour-webapp/zones-maps-and-analytics/heterogeneity-factor.md).
# Heterogeniteitsfactor
Meet de variatie binnen een perceel om percelen te identificeren waar zonering en variabele doseringen de meeste waarde opleveren.
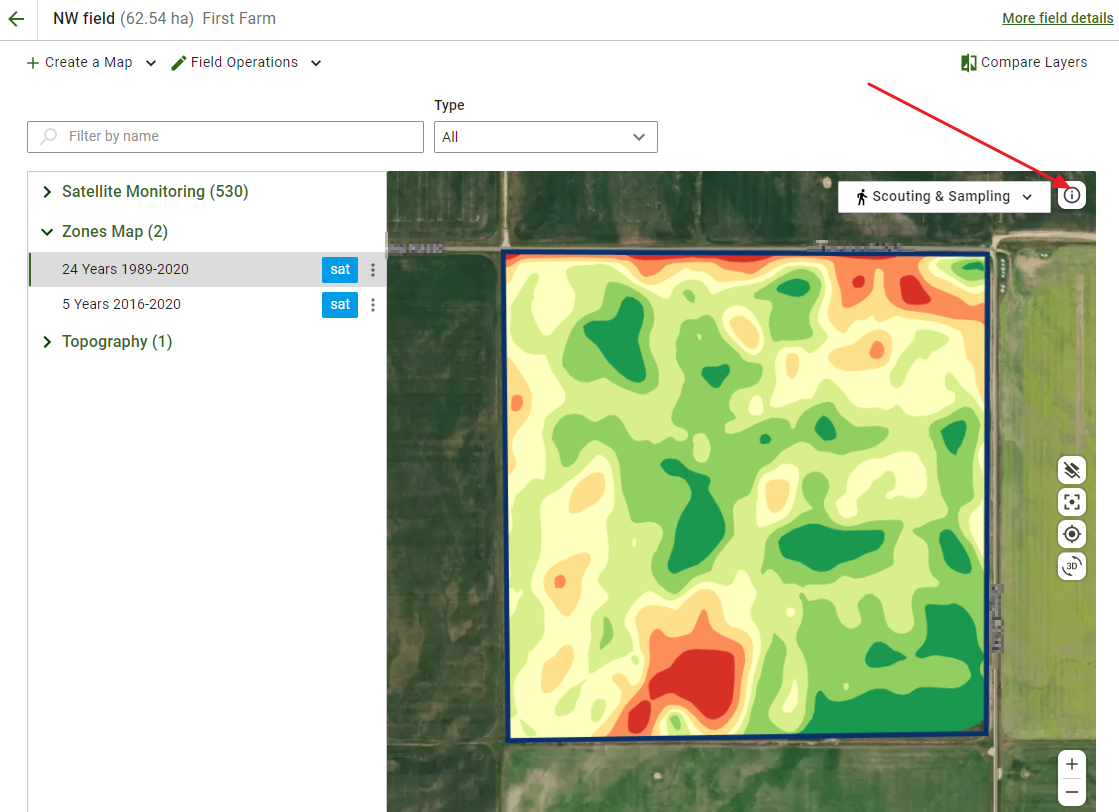
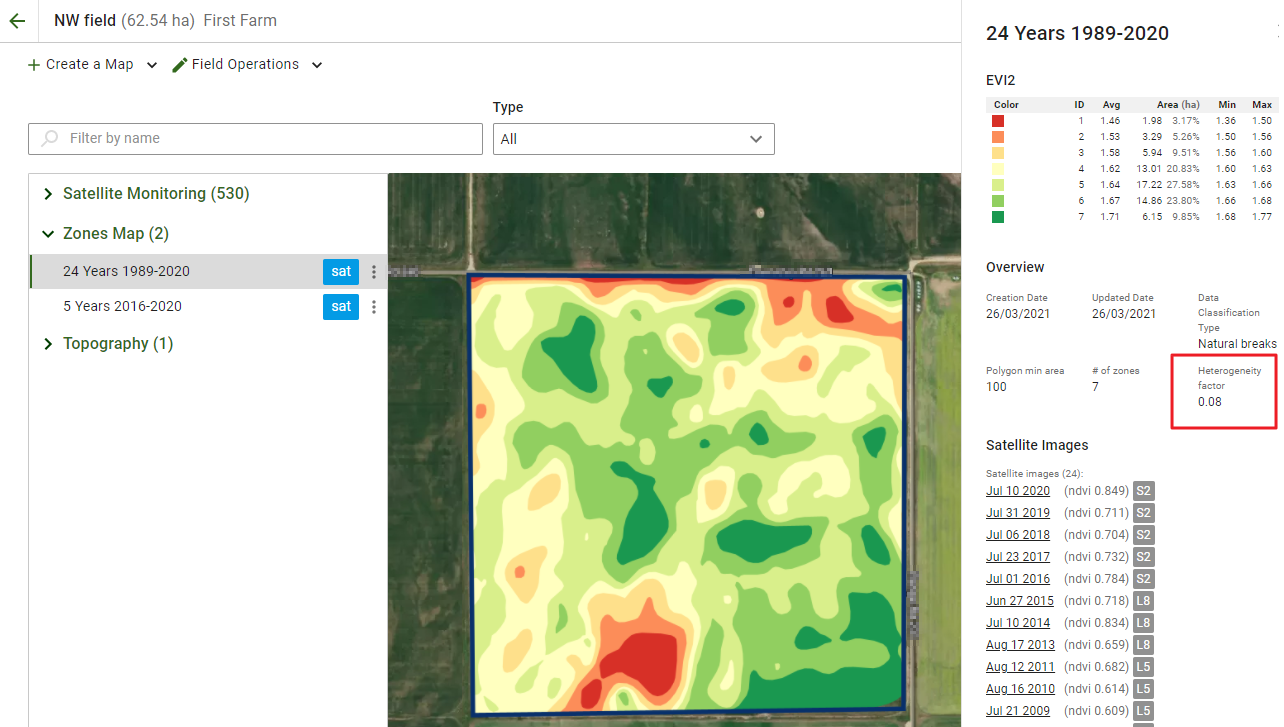
Een van de functies van GeoPard is het weergeven van de heterogeniteitsfactor van uw percelen. U kunt deze bekijken door het gewenste perceel te openen, de zonenkaart te selecteren en op het **Info** -pictogram op de kaart te klikken. Het zijpaneel wordt geopend.
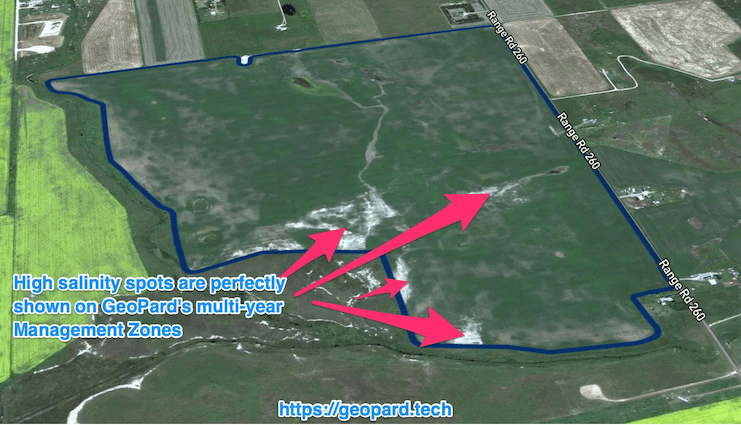
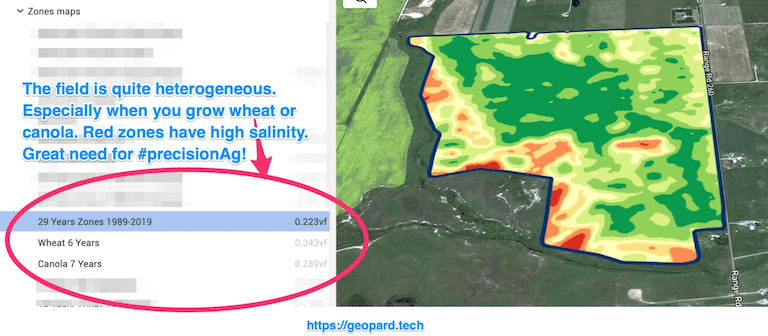
De heterogeniteitsfactor geeft de mate van heterogeniteit/variabiliteit van uw percelen weer. Hoe meer variatie een perceel vertoont, hoe groter de behoefte aan precisielandbouwtechnologie. Deze factor is vooral nuttig in combinatie met de meerjarige analyses van GeoPard (een geschiedenis van 30 jaar).
Als u veel percelen hebt, kunt u hiermee bepalen op welke percelen u het eerst [Toepassingen met variabele dosering](http://test/) (zaaien, bemesten, spuiten) wilt toepassen.
Door de heterogeniteitsfactor van GeoPard te combineren met meerjarige analyses, kunt u het meest besparen op middelen in de meest heterogene percelen.
---
# Agent Instructions
This documentation is published with GitBook. GitBook is the documentation platform designed so that both humans and AI agents can read, navigate, and reason over technical content effectively. Learn more at gitbook.com.
## Querying This Documentation
If you need additional information that is not directly available in this page, you can query the documentation by asking a question.
Perform an HTTP GET request on the following URL with the `ask` and `goal` query parameters:
```
GET https://docs.geopard.tech/geopard-tutorials/nl/producttour-webapp/zones-maps-and-analytics/heterogeneity-factor.md?ask=&goal=
```
`ask` is the immediate question: it should be specific, self-contained, and written in natural language.
`goal` is what the user is ultimately trying to achieve, the reason they need the answer. Sharing it helps GitBook give you a better, more relevant answer. A goal is most helpful when it describes the outcome the user wants rather than restating the question. For example, with `ask=how do I create an API token`, a goal like `automate deployments from our CI pipeline` lets GitBook tailor the answer to that use case.
The response will contain a direct answer to the question and relevant excerpts and sources from the documentation.
Use this mechanism when the answer is not explicitly present in the current page, you need clarification or additional context, or you want to retrieve related documentation sections.