> For the complete documentation index, see [llms.txt](https://docs.geopard.tech/geopard-tutorials/llms.txt). Markdown versions of documentation pages are available by appending `.md` to page URLs; this page is available as [Markdown](https://docs.geopard.tech/geopard-tutorials/jpn/tsu-webapuri/monitaringu/gurafu.md).
# 作物発達指数グラフ
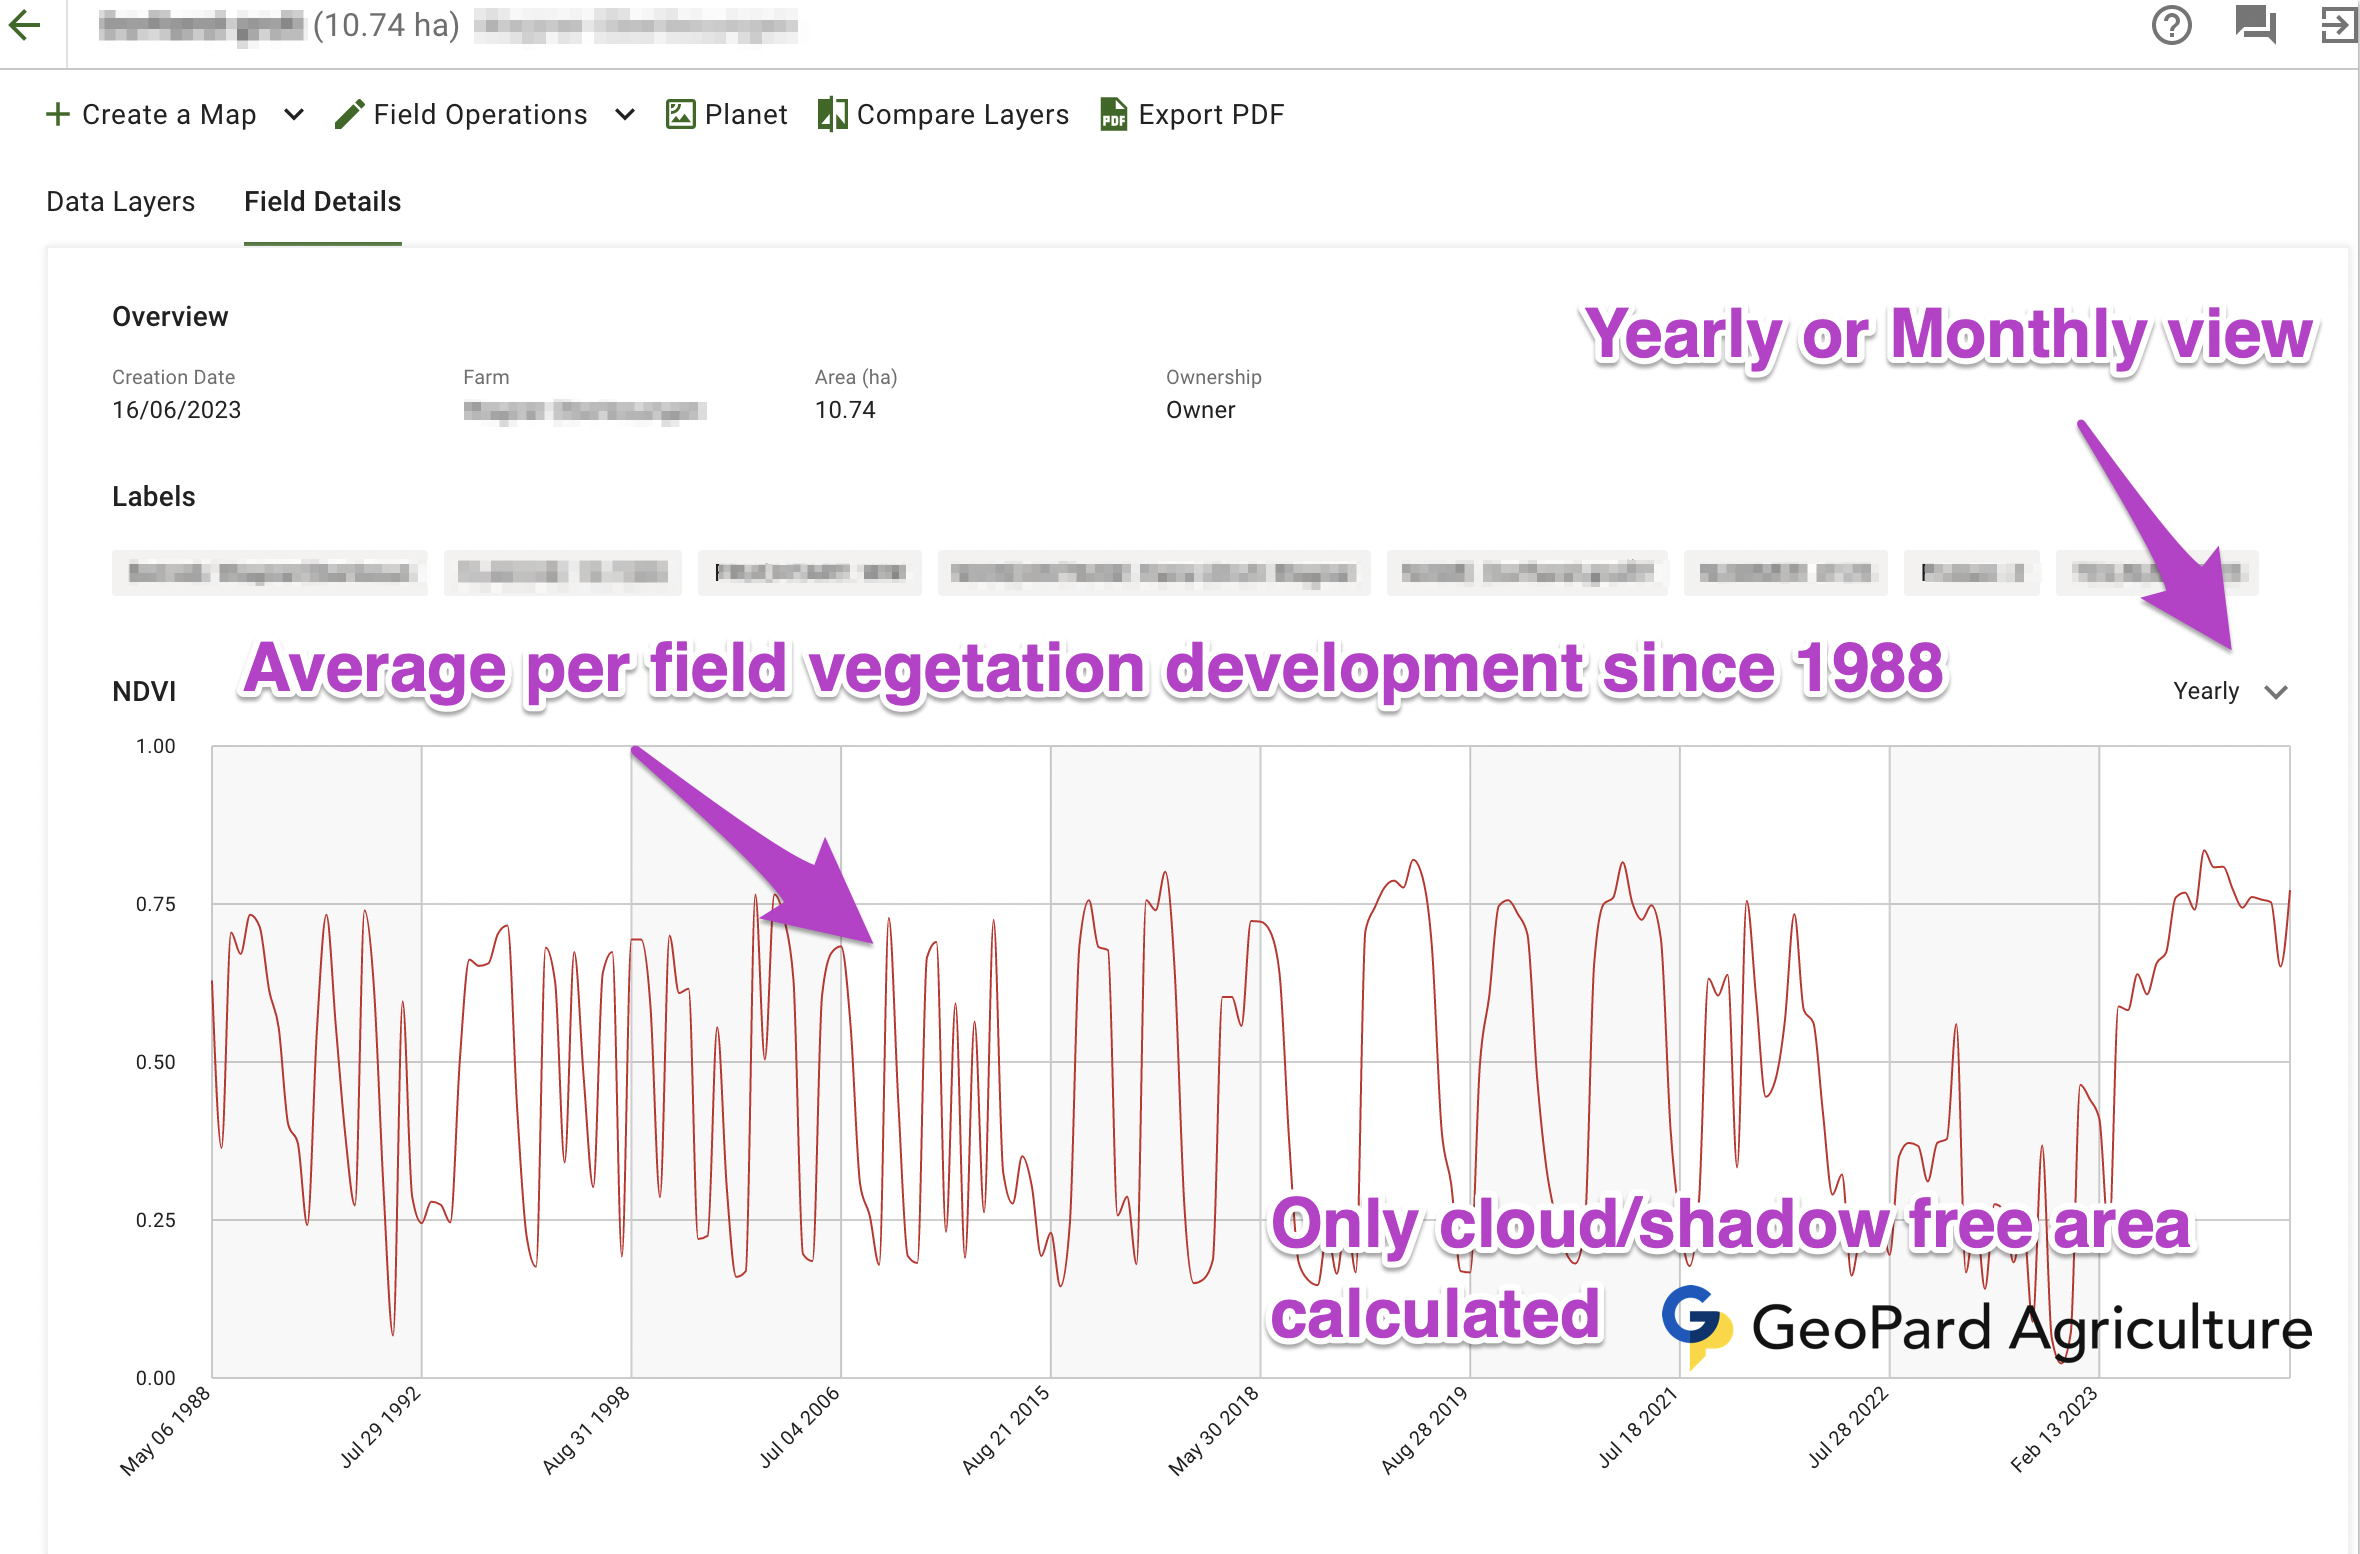
日付や圃場ごとの画像値を比較するグラフで、作物の発達を時系列で追跡します。
GeoPardは1988年まで遡る作物生育グラフを提供します。これらは各圃場ごとに自動生成され、以下のデータのみを使用します **雲のない、影のない** エリア。ポイントにカーソルを合わせると平均NDVI値が表示されます。切り替え可能です **年次と月次の** 表示を切り替えて、詳細な洞察を得られます。
これらのグラフは農家が **最適な収穫時期を見極める**、より広い範囲で作物を監視し、生産性と持続可能性を高めるのに役立ちます。
---
# Agent Instructions
This documentation is published with GitBook. GitBook is the documentation platform designed so that both humans and AI agents can read, navigate, and reason over technical content effectively. Learn more at gitbook.com.
## Querying This Documentation
If you need additional information that is not directly available in this page, you can query the documentation by asking a question.
Perform an HTTP GET request on the following URL with the `ask` and `goal` query parameters:
```
GET https://docs.geopard.tech/geopard-tutorials/jpn/tsu-webapuri/monitaringu/gurafu.md?ask=&goal=
```
`ask` is the immediate question: it should be specific, self-contained, and written in natural language.
`goal` is what the user is ultimately trying to achieve, the reason they need the answer. Sharing it helps GitBook give you a better, more relevant answer. A goal is most helpful when it describes the outcome the user wants rather than restating the question. For example, with `ask=how do I create an API token`, a goal like `automate deployments from our CI pipeline` lets GitBook tailor the answer to that use case.
The response will contain a direct answer to the question and relevant excerpts and sources from the documentation.
Use this mechanism when the answer is not explicitly present in the current page, you need clarification or additional context, or you want to retrieve related documentation sections.