> For the complete documentation index, see [llms.txt](https://docs.geopard.tech/geopard-tutorials/llms.txt). Markdown versions of documentation pages are available by appending `.md` to page URLs; this page is available as [Markdown](https://docs.geopard.tech/geopard-tutorials/jpn/tsu-webapuri/equation-based-analytics/batch-equation-analytics.md).
# 一括方程式分析
複数の圃場に対して、方程式ベースの分析を並行して実行します。
この **バッチ分析** 機能は、 [数式ベースの分析](https://docs.geopard.tech/geopard-tutorials/jpn/tsu-webapuri/equation-based-analytics.md) を拡張し、1つの数式を複数の圃場に一度に適用できるようにします。これにより、数式マップの生成が速くなり、大規模なワークフローも管理しやすくなります。
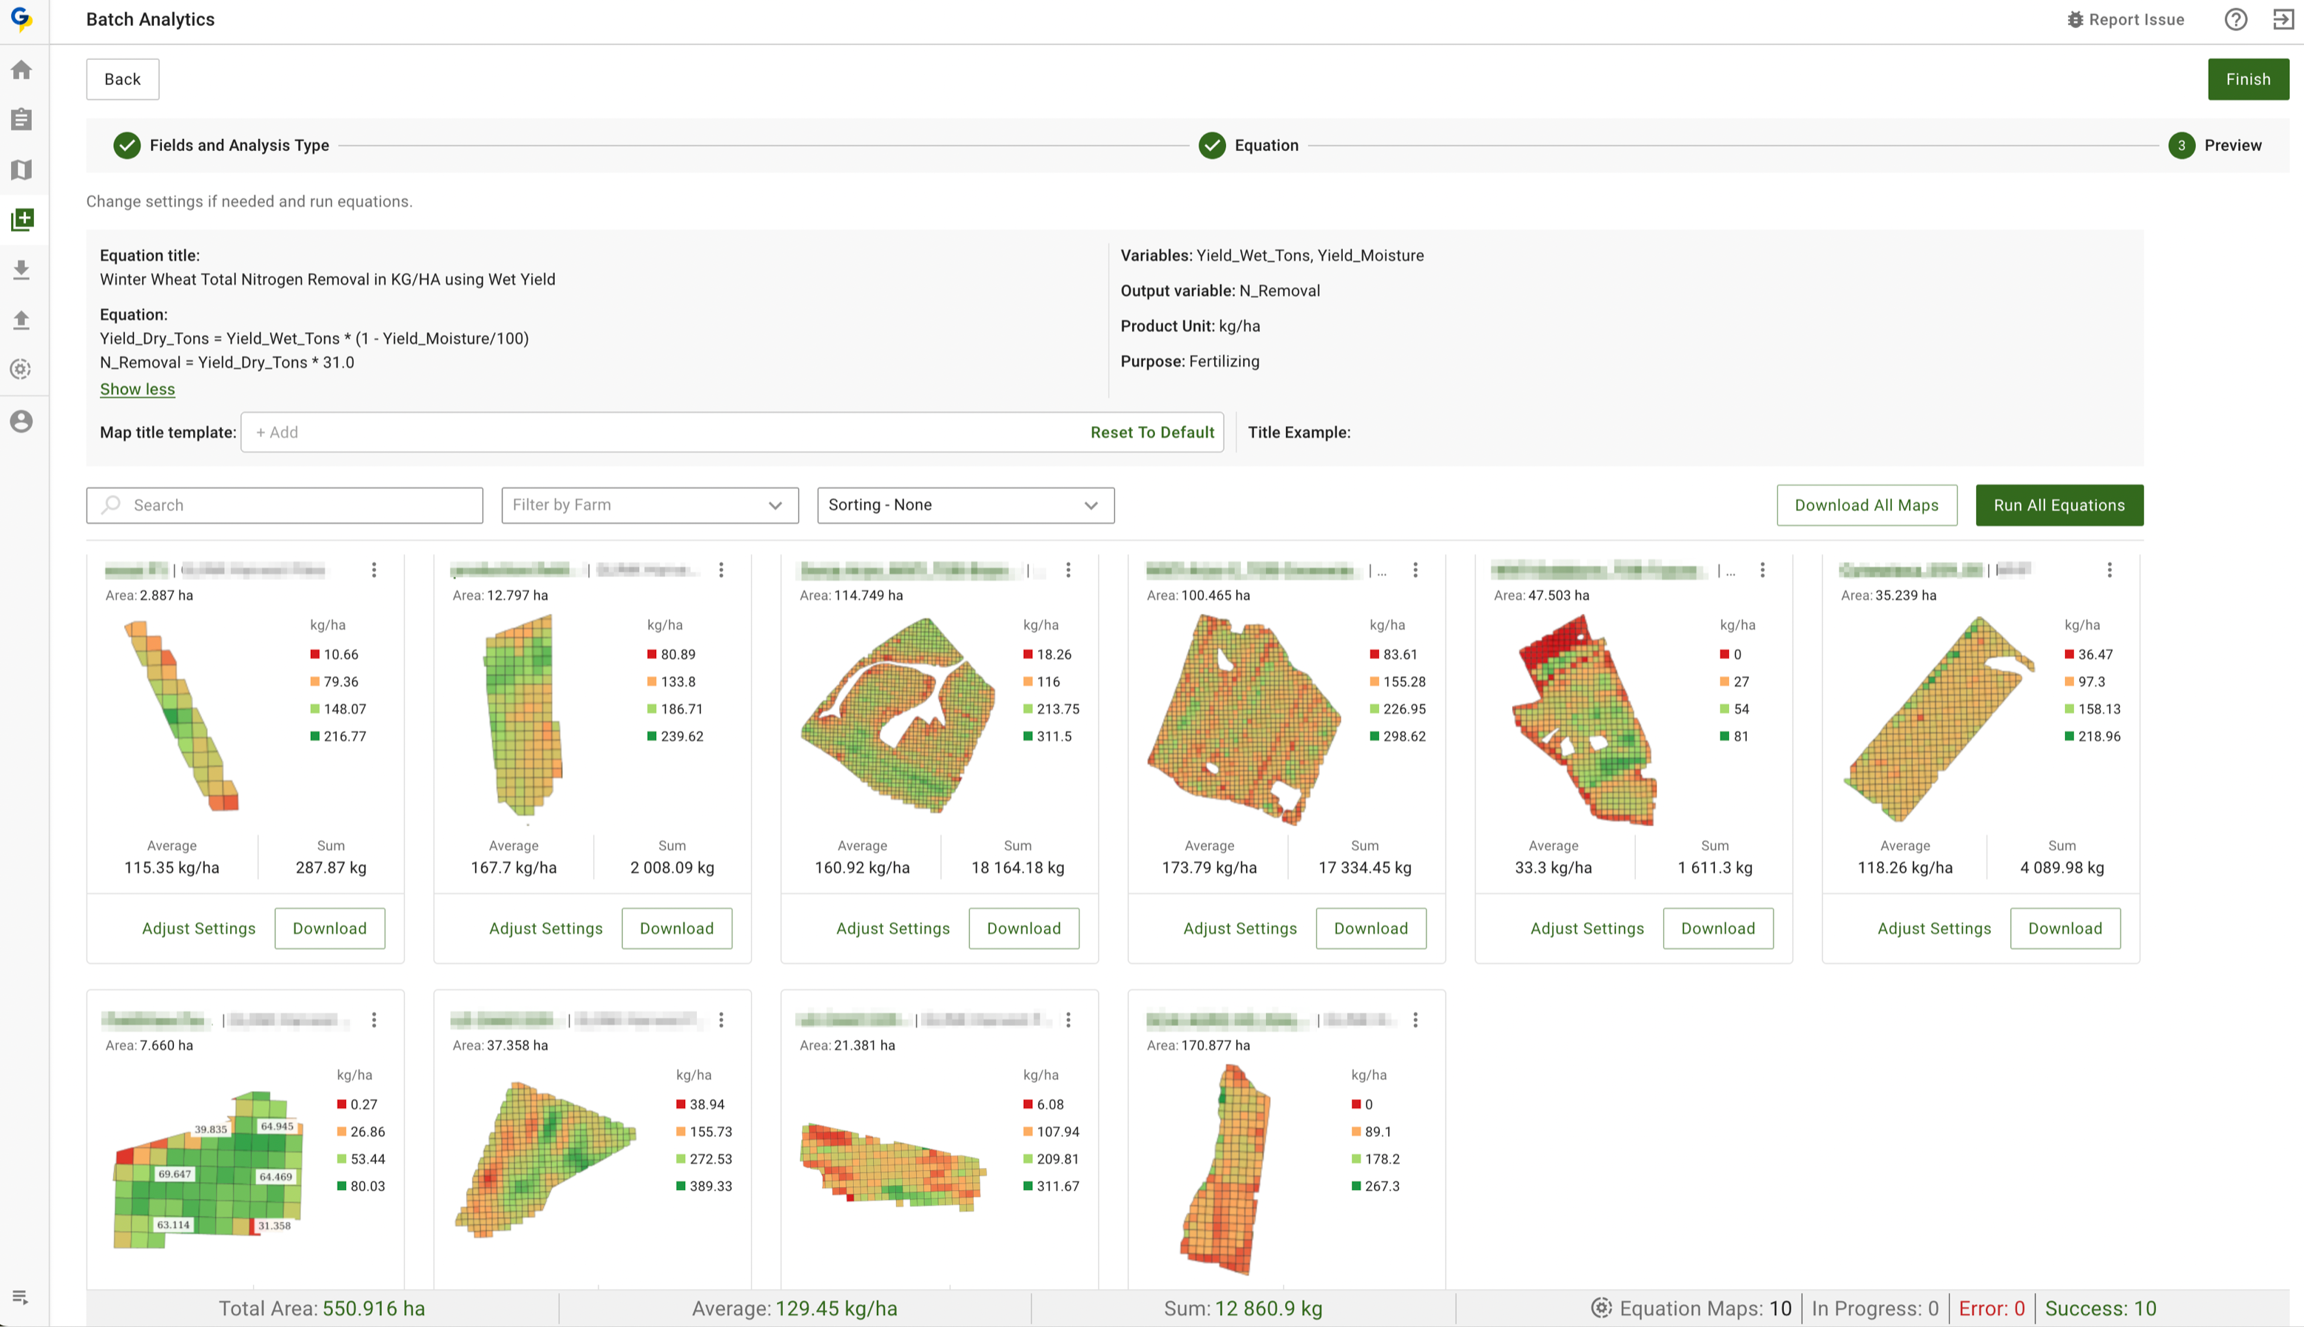
アプリは、数式内の各変数に必要なデータセットと属性を自動的に特定し、正確な結果を実現します。生成される各マップには合計や平均などの主要な統計情報が含まれます。また、生成したすべてのマップの概要がページ下部に表示されるため、簡単に確認できます。
### 主な機能
* 収益マップや、播種・散布・施肥・養分吸収量の計算に使うVRAマップなど、あらゆる圃場グループのマップを生成できます。
* すべての圃場の平均値と資材投入量の合計を計算し、より効率的な購入計画に役立てられます。効率性、 [肥料利用効率](https://geopard.tech/blog/nitrogen-use-efficiency-use-case-from-lva-john-deere-dealer-from-germany), [収益マップ](https://geopard.tech/blog/introducing-geopards-profit-maps-a-step-forward-in-precision-agriculture)、肥料吸収量、衛星画像に基づく数式など、GeoPardの数式や独自の数式を使用できます。
* GeoPardは変数をレイヤーや属性に自動的に関連付けます。Yield DryをYieldデータセットに、pHを土壌サンプリングのpHに手動で対応付ける必要はありません。
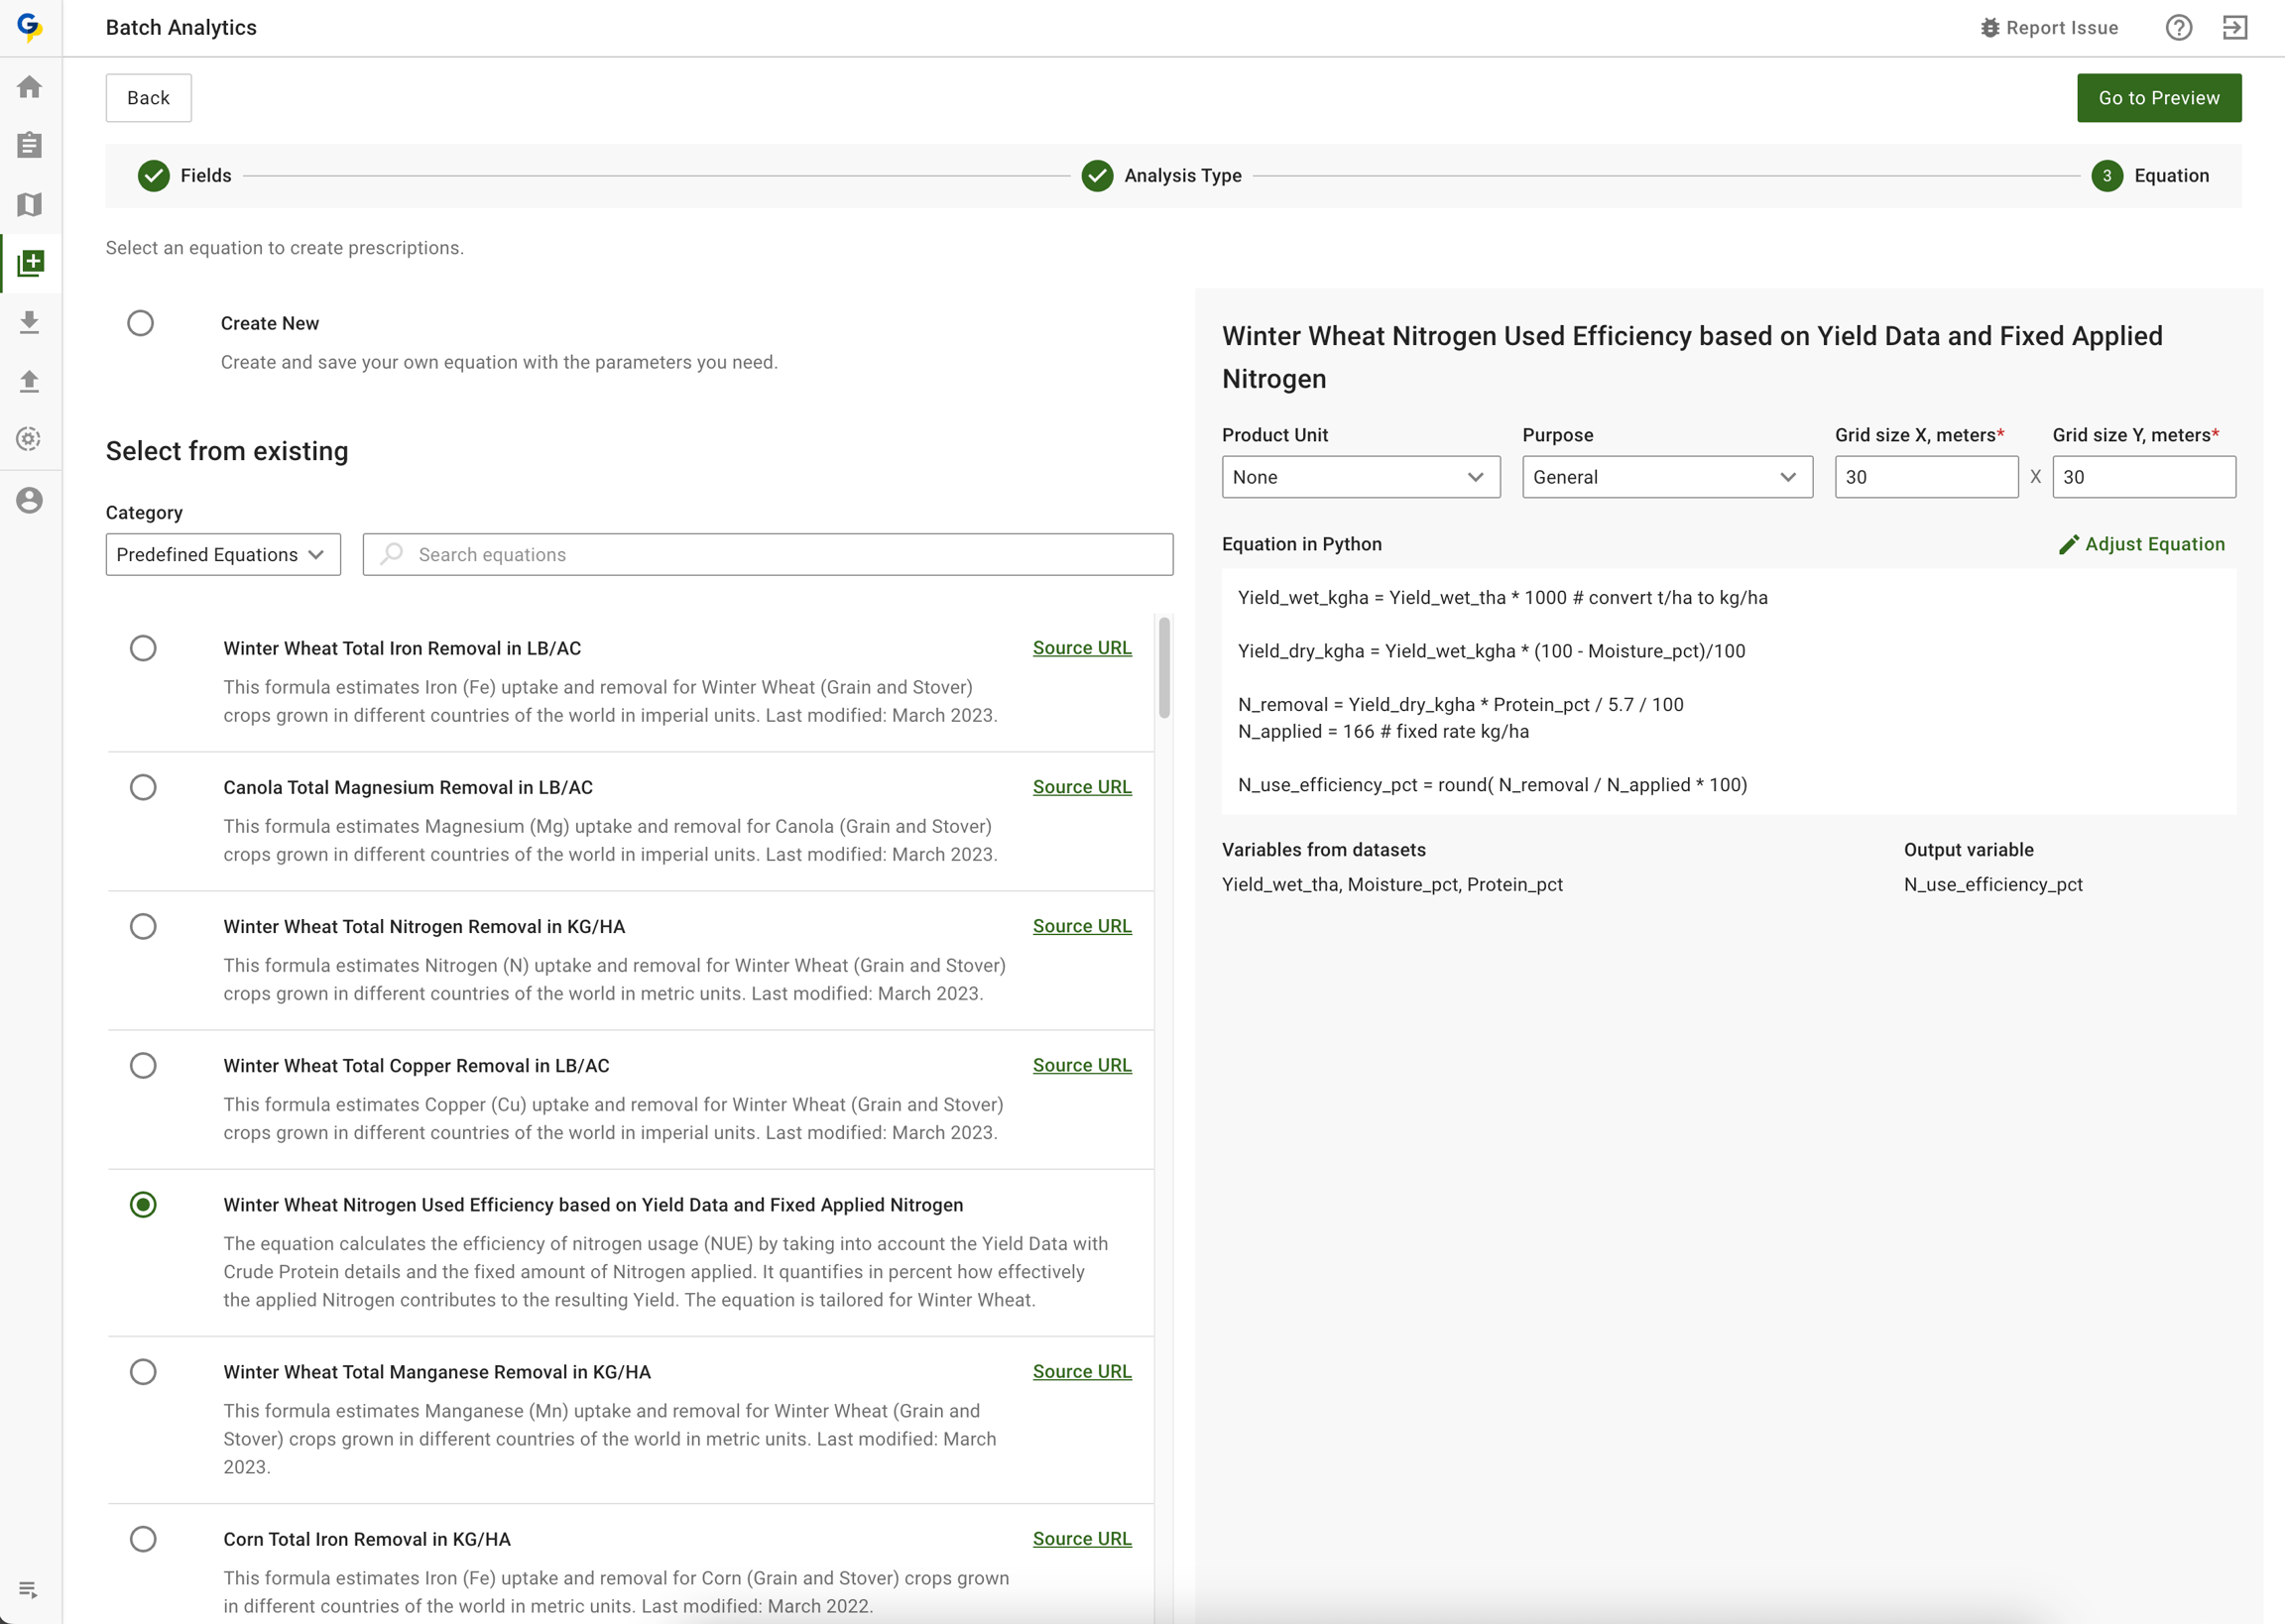
### ステップ1 - 数式と圃場を選択(または作成)する
ステップ1 - 数式と圃場を選択(または作成)する
### ステップ2 - 収量と水分のデータに基づいて窒素除去量を一括計算する
ステップ2 - 結果を確認し、必要に応じてデータレイヤーと数式を調整する
### ステップ3 - 各マップを個別または一括で再実行する
### ステップ4 - 作成したすべてのマップ、またはマップを1つずつダウンロードする
---
# Agent Instructions
This documentation is published with GitBook. GitBook is the documentation platform designed so that both humans and AI agents can read, navigate, and reason over technical content effectively. Learn more at gitbook.com.
## Querying This Documentation
If you need additional information that is not directly available in this page, you can query the documentation by asking a question.
Perform an HTTP GET request on the following URL with the `ask` and `goal` query parameters:
```
GET https://docs.geopard.tech/geopard-tutorials/jpn/tsu-webapuri/equation-based-analytics/batch-equation-analytics.md?ask=&goal=
```
`ask` is the immediate question: it should be specific, self-contained, and written in natural language.
`goal` is what the user is ultimately trying to achieve, the reason they need the answer. Sharing it helps GitBook give you a better, more relevant answer. A goal is most helpful when it describes the outcome the user wants rather than restating the question. For example, with `ask=how do I create an API token`, a goal like `automate deployments from our CI pipeline` lets GitBook tailor the answer to that use case.
The response will contain a direct answer to the question and relevant excerpts and sources from the documentation.
Use this mechanism when the answer is not explicitly present in the current page, you need clarification or additional context, or you want to retrieve related documentation sections.