> For the complete documentation index, see [llms.txt](https://docs.geopard.tech/geopard-tutorials/llms.txt). Markdown versions of documentation pages are available by appending `.md` to page URLs; this page is available as [Markdown](https://docs.geopard.tech/geopard-tutorials/jpn/tsu-webapuri/ekusupto-daunrdo/wogeotiffmatahageojsontoshiteekusupto.md).
# 衛星画像をGeoTIFFまたはGeoJSONとしてエクスポート
GIS分析や外部ワークフロー向けに、衛星画像をGeoTIFFまたはGeoJSONでエクスポートします。
GeoPardでは、圃場に関連する衛星画像をGeoTIFFおよびGeoJSON形式でエクスポートできます。
## エクスポート用ユーザーインターフェース
圃場プロファイルページに移動し、画像を選択します。
エクスポートオプションを選択します。種類(GeoJSONまたはGeoTIFF)と、バッファ済みピクセル数です。\
その後、 **ダウンロード** ボタンをクリックします。
エクスポートされたファイル内のデータは、衛星画像の提供元によって異なります。
## Sentinel-2画像
A **Sentinel-2** 画像には以下が含まれます:
1. *Band1(GeoTIFF)またはマスク(GeoJSON)* ピクセルが圃場境界の内側にあるかどうかを示します
2. *Band2(GeoTIFF)* または *nir* *(GeoJSON)* NIRバンドを表します
3. *Band3(GeoTIFF)* または *red(GeoJSON)* REDバンドを表します
4. *Band4(GeoTIFF)* または *green(GeoJSON)* GREENバンドを表します
5. *Band5(GeoTIFF)* または *blue(GeoJSON)* BLUEバンドを表します
6. *Band6(GeoTIFF)* または *rededge(GeoJSON)* RED EDGEバンドを表します
7. *Band7(GeoTIFF)* または *swir* *(GeoJSON)* SWIRバンドを表します
## Landsat画像
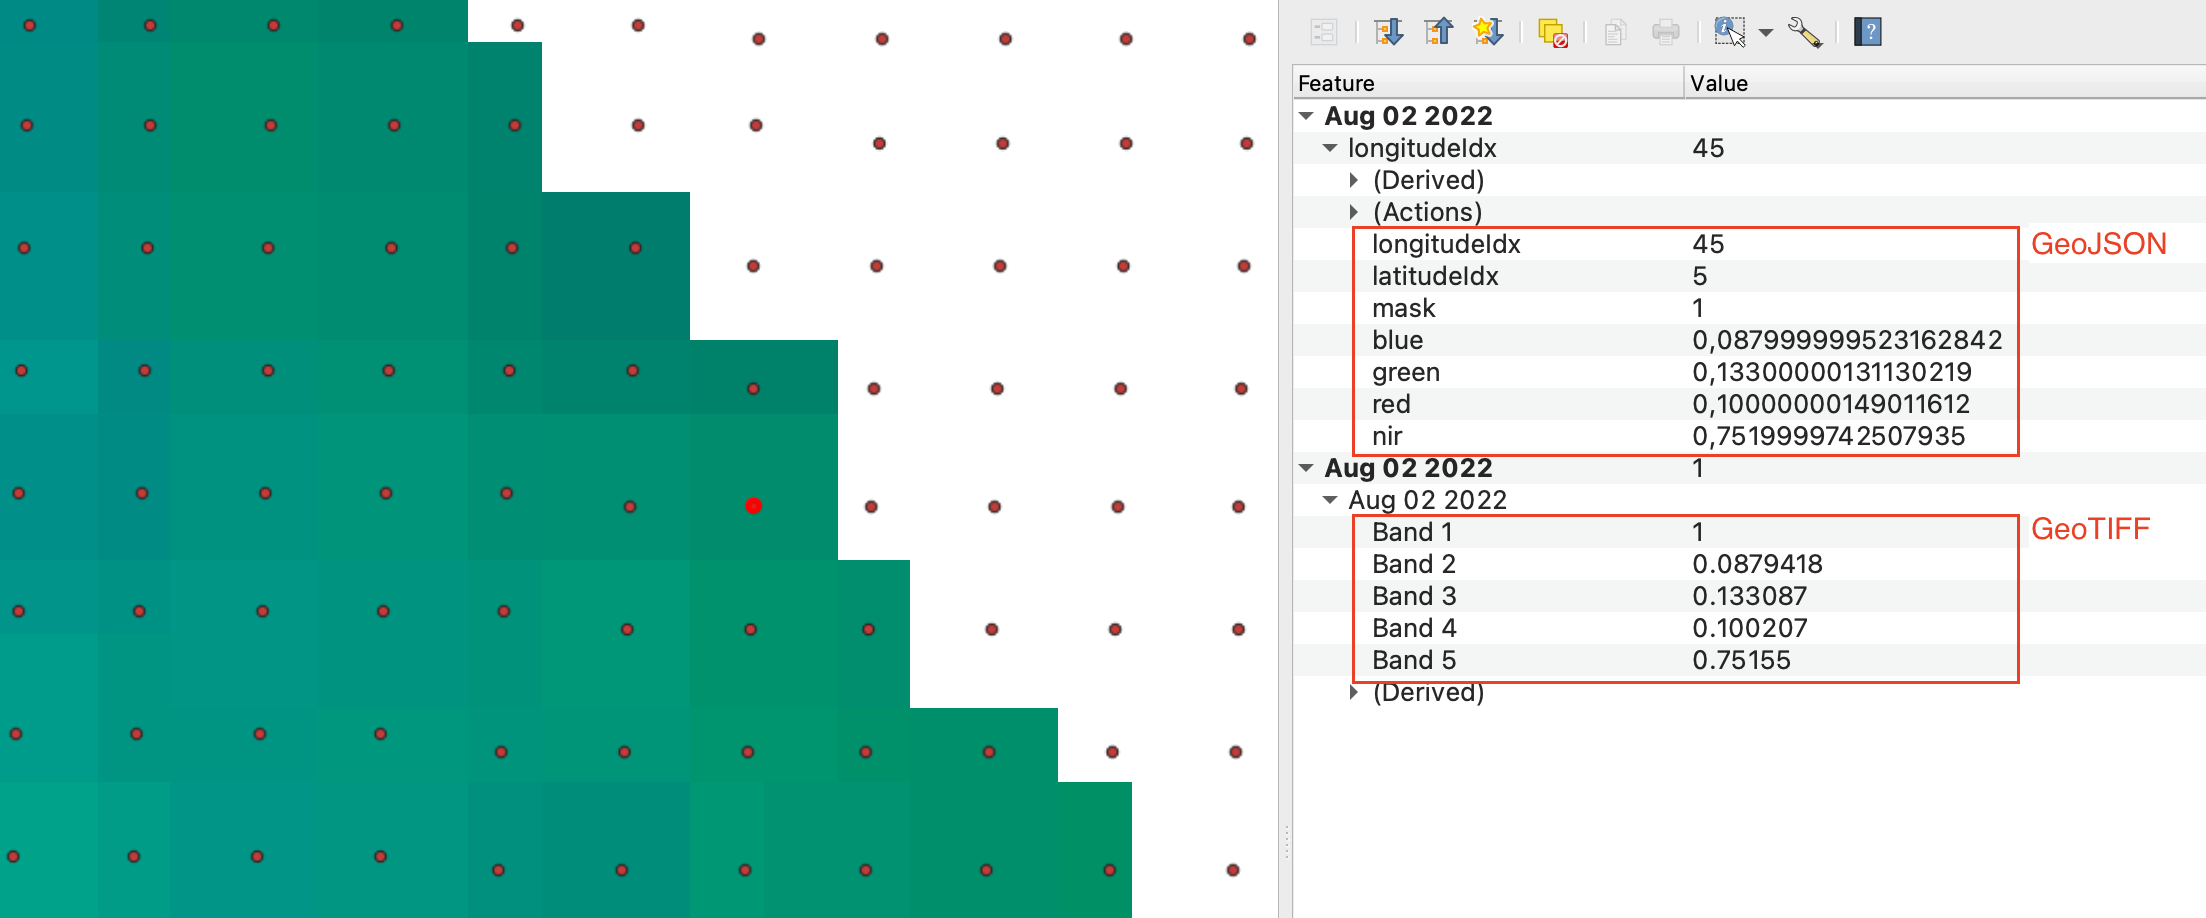
A **Landsat** 画像には以下が含まれます:
1. *Band1(GeoTIFF)またはマスク(GeoJSON)* ピクセルが圃場境界の内側にあるかどうかを示します
2. *Band2(GeoTIFF)またはnir* *(GeoJSON)* NIRバンドを表します
3. *Band3(GeoTIFF)* または *red(GeoJSON)* REDバンドを表します
4. *Band4(GeoTIFF)* または *green(GeoJSON)* GREENバンドを表します
5. *Band5(GeoTIFF)* または *blue(GeoJSON)* BLUEバンドを表します
QGISでは出力はこのように表示されます:
## Planet画像
A **Planet** 画像の派生データには正規化値が含まれます:
1. *Band1(GeoTIFF)* または *マスク(GeoJSON)* ピクセルが圃場境界の内側にあるかどうかを示します
2. *Band2(GeoTIFF)* または *blue(GeoJSON)* BLUEバンドを表します
3. *Band3(GeoTIFF)* または *green(GeoJSON)* GREENバンドを表します
4. *Band4(GeoTIFF)* または *red(GeoJSON)* REDバンドを表します
5. *Band5(GeoTIFF)* または *nir(GeoJSON)* NIRバンドを表します
---
# Agent Instructions
This documentation is published with GitBook. GitBook is the documentation platform designed so that both humans and AI agents can read, navigate, and reason over technical content effectively. Learn more at gitbook.com.
## Querying This Documentation
If you need additional information that is not directly available in this page, you can query the documentation by asking a question.
Perform an HTTP GET request on the following URL with the `ask` and `goal` query parameters:
```
GET https://docs.geopard.tech/geopard-tutorials/jpn/tsu-webapuri/ekusupto-daunrdo/wogeotiffmatahageojsontoshiteekusupto.md?ask=&goal=
```
`ask` is the immediate question: it should be specific, self-contained, and written in natural language.
`goal` is what the user is ultimately trying to achieve, the reason they need the answer. Sharing it helps GitBook give you a better, more relevant answer. A goal is most helpful when it describes the outcome the user wants rather than restating the question. For example, with `ask=how do I create an API token`, a goal like `automate deployments from our CI pipeline` lets GitBook tailor the answer to that use case.
The response will contain a direct answer to the question and relevant excerpts and sources from the documentation.
Use this mechanism when the answer is not explicitly present in the current page, you need clarification or additional context, or you want to retrieve related documentation sections.