> For the complete documentation index, see [llms.txt](https://docs.geopard.tech/geopard-tutorials/llms.txt). Markdown versions of documentation pages are available by appending `.md` to page URLs; this page is available as [Markdown](https://docs.geopard.tech/geopard-tutorials/jpn/tsu-webapuri/dta.md).

# 収量データ & 収穫分析

GeoPardで収穫収量データを取り込み、処理、クリーニング、復元、分析し、処方マップや利益マップを作成して共有します。

GeoPardを使って、元の収穫機ファイルを意思決定に使える収量レイヤーに変換します。

### 典型的なワークフロー

{% stepper %}
{% step %}

### インポート

シェープファイル、機械ファイル、または John Deere から収穫データを取り込みます。まずファイルをインポートし、その後、処理、クレンジング、較正、欠損補完を行い、その結果を農学的な推奨に再利用します。
{% endstep %}

{% step %}

### 処理

属性、単位、圃場への適合、機械固有の詳細を確認します。
{% endstep %}

{% step %}

### クレンジングと較正

ノイズを除去します。ストライプ状のムラを修正します。値を信頼できる合計値に合わせます。
{% endstep %}

{% step %}

### 欠損を復元

記録が欠けている、または不完全な箇所では、合成収量を使用します。
{% endstep %}

{% step %}

### 推奨を作成

クレンジング済み収量からゾーン、方程式、収益性ワークフローを作成します。
{% endstep %}

{% step %}

### 出力を共有

収量由来のレイヤーと推奨を John Deere Ops Center に送信します。
{% endstep %}
{% endstepper %}

### 1. 収量データをインポート

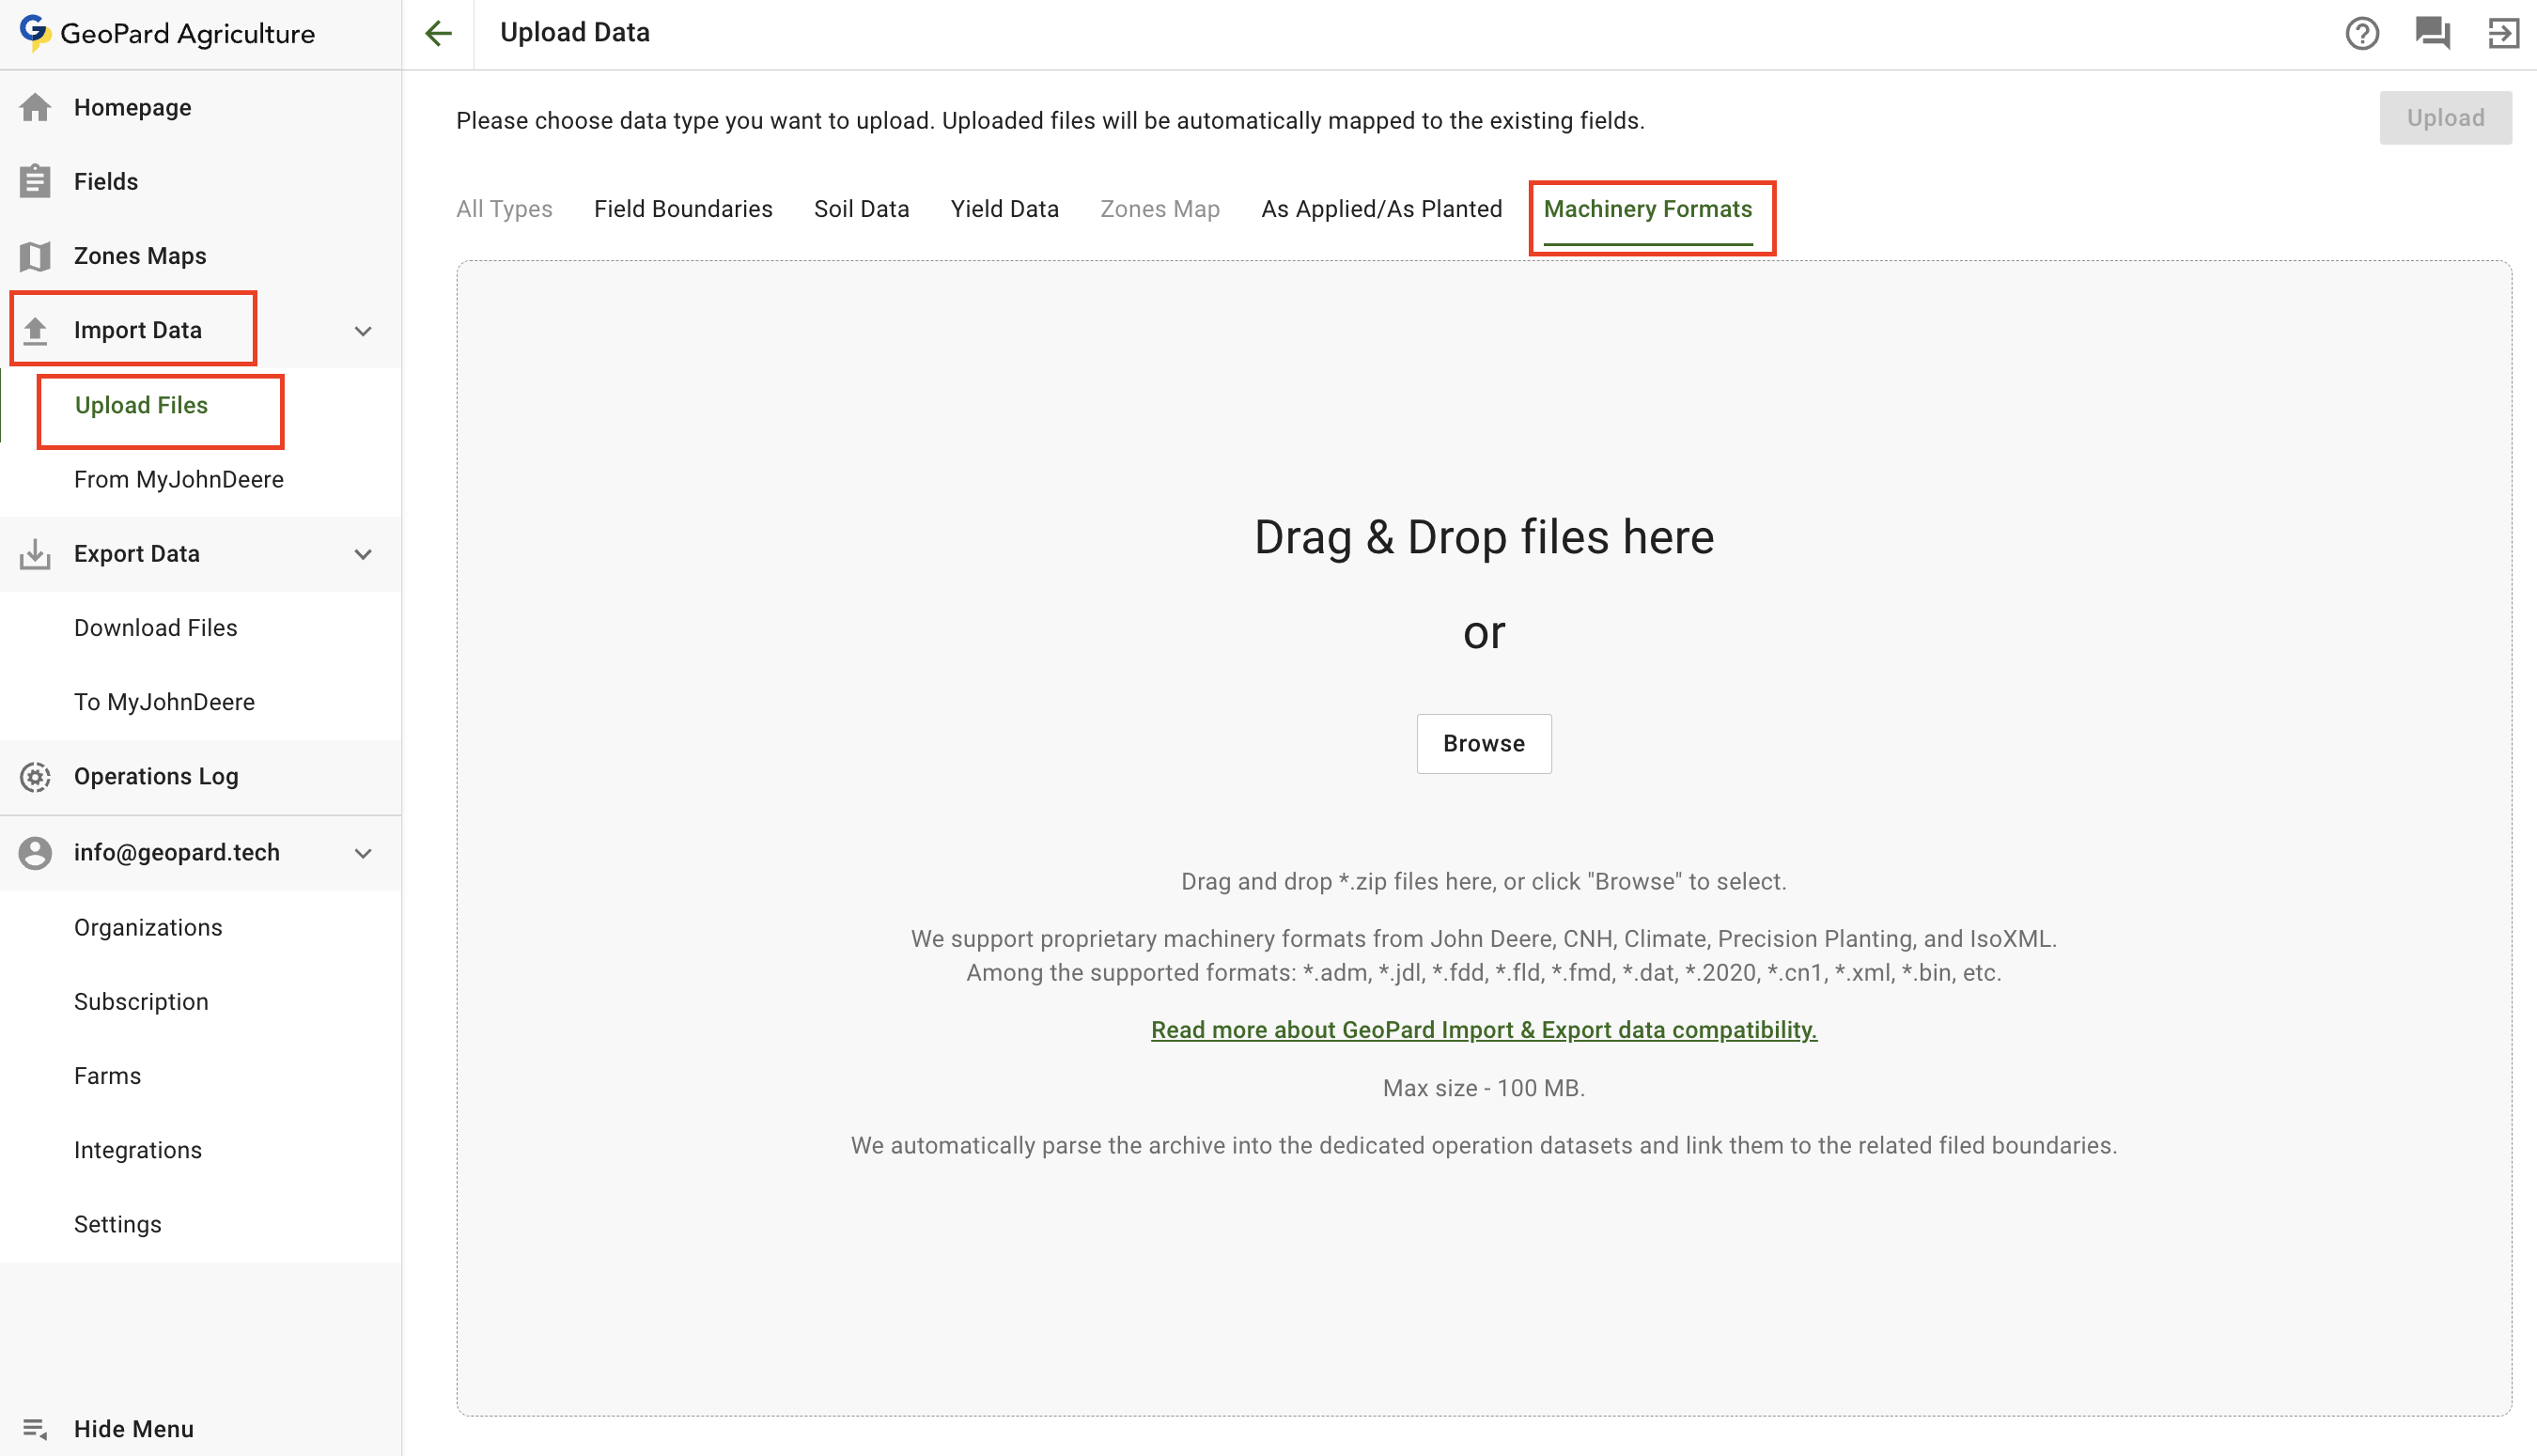
GeoPard は標準的な GIS ファイルと機械フォーマットをサポートします。

一般的な入力例は以下です `shp`, `ISOXML`、および次のような独自形式です `jdl`, `cn1`, `adm`, `dat`、および関連する機械アーカイブ。

John Deere Operations Center から収量を直接インポートすることもできます。

<figure><img src="https://1993076779-files.gitbook.io/~/files/v0/b/gitbook-x-prod.appspot.com/o/spaces%2FYICBELdyAXXebKAzfLOR%2Fuploads%2FAyA8wGTgxwgAZsjOhlmz%2Fimage.png?alt=media&amp;token=0aeed3da-5098-404c-a881-2025f690f4bd" alt="Upload machinery files"><figcaption><p>機械ファイルをアップロードすると、GeoPard がそれをデータセットとして解析します。</p></figcaption></figure>

正確な流れは以下のページを参照してください:

* [収量データのインポート](/geopard-tutorials/jpn/tsu-webapuri/dtanorimi/dtanorimi.md)
* [機械の独自フォーマット](/geopard-tutorials/jpn/tsu-webapuri/dtanorimi/mk.md)
* [MyJohnDeere からのインポート](/geopard-tutorials/jpn/tsu-webapuri/dtanorimi/myjohndeerekararimu.md)

### 2. 収量データの処理

インポート後、GeoPard はデータセットを圃場に紐づけ、収穫属性を表示します。

この段階で、そのデータセットが使えるかどうかを確認します。

まず次の点を確認してください:

* 主要な収量属性が正しく選択されている
* 単位が正しく、比較可能である
* 水分、速度、刈幅、進行方向が妥当である
* データが圃場境界に適合している
* 必要に応じて機械の走行経路や収穫日が利用できる

この確認は、クレンジング、ゾーニング、方程式作成の前に役立ちます。

{% hint style="info" %}
収量データセットには、しばしば複数の有用なレイヤーが含まれます。

収量量だけでなく、水分、乾物、速度、距離、進行方向、機械の走行パターンも確認してください。
{% endhint %}

### 3. クレンジングと較正

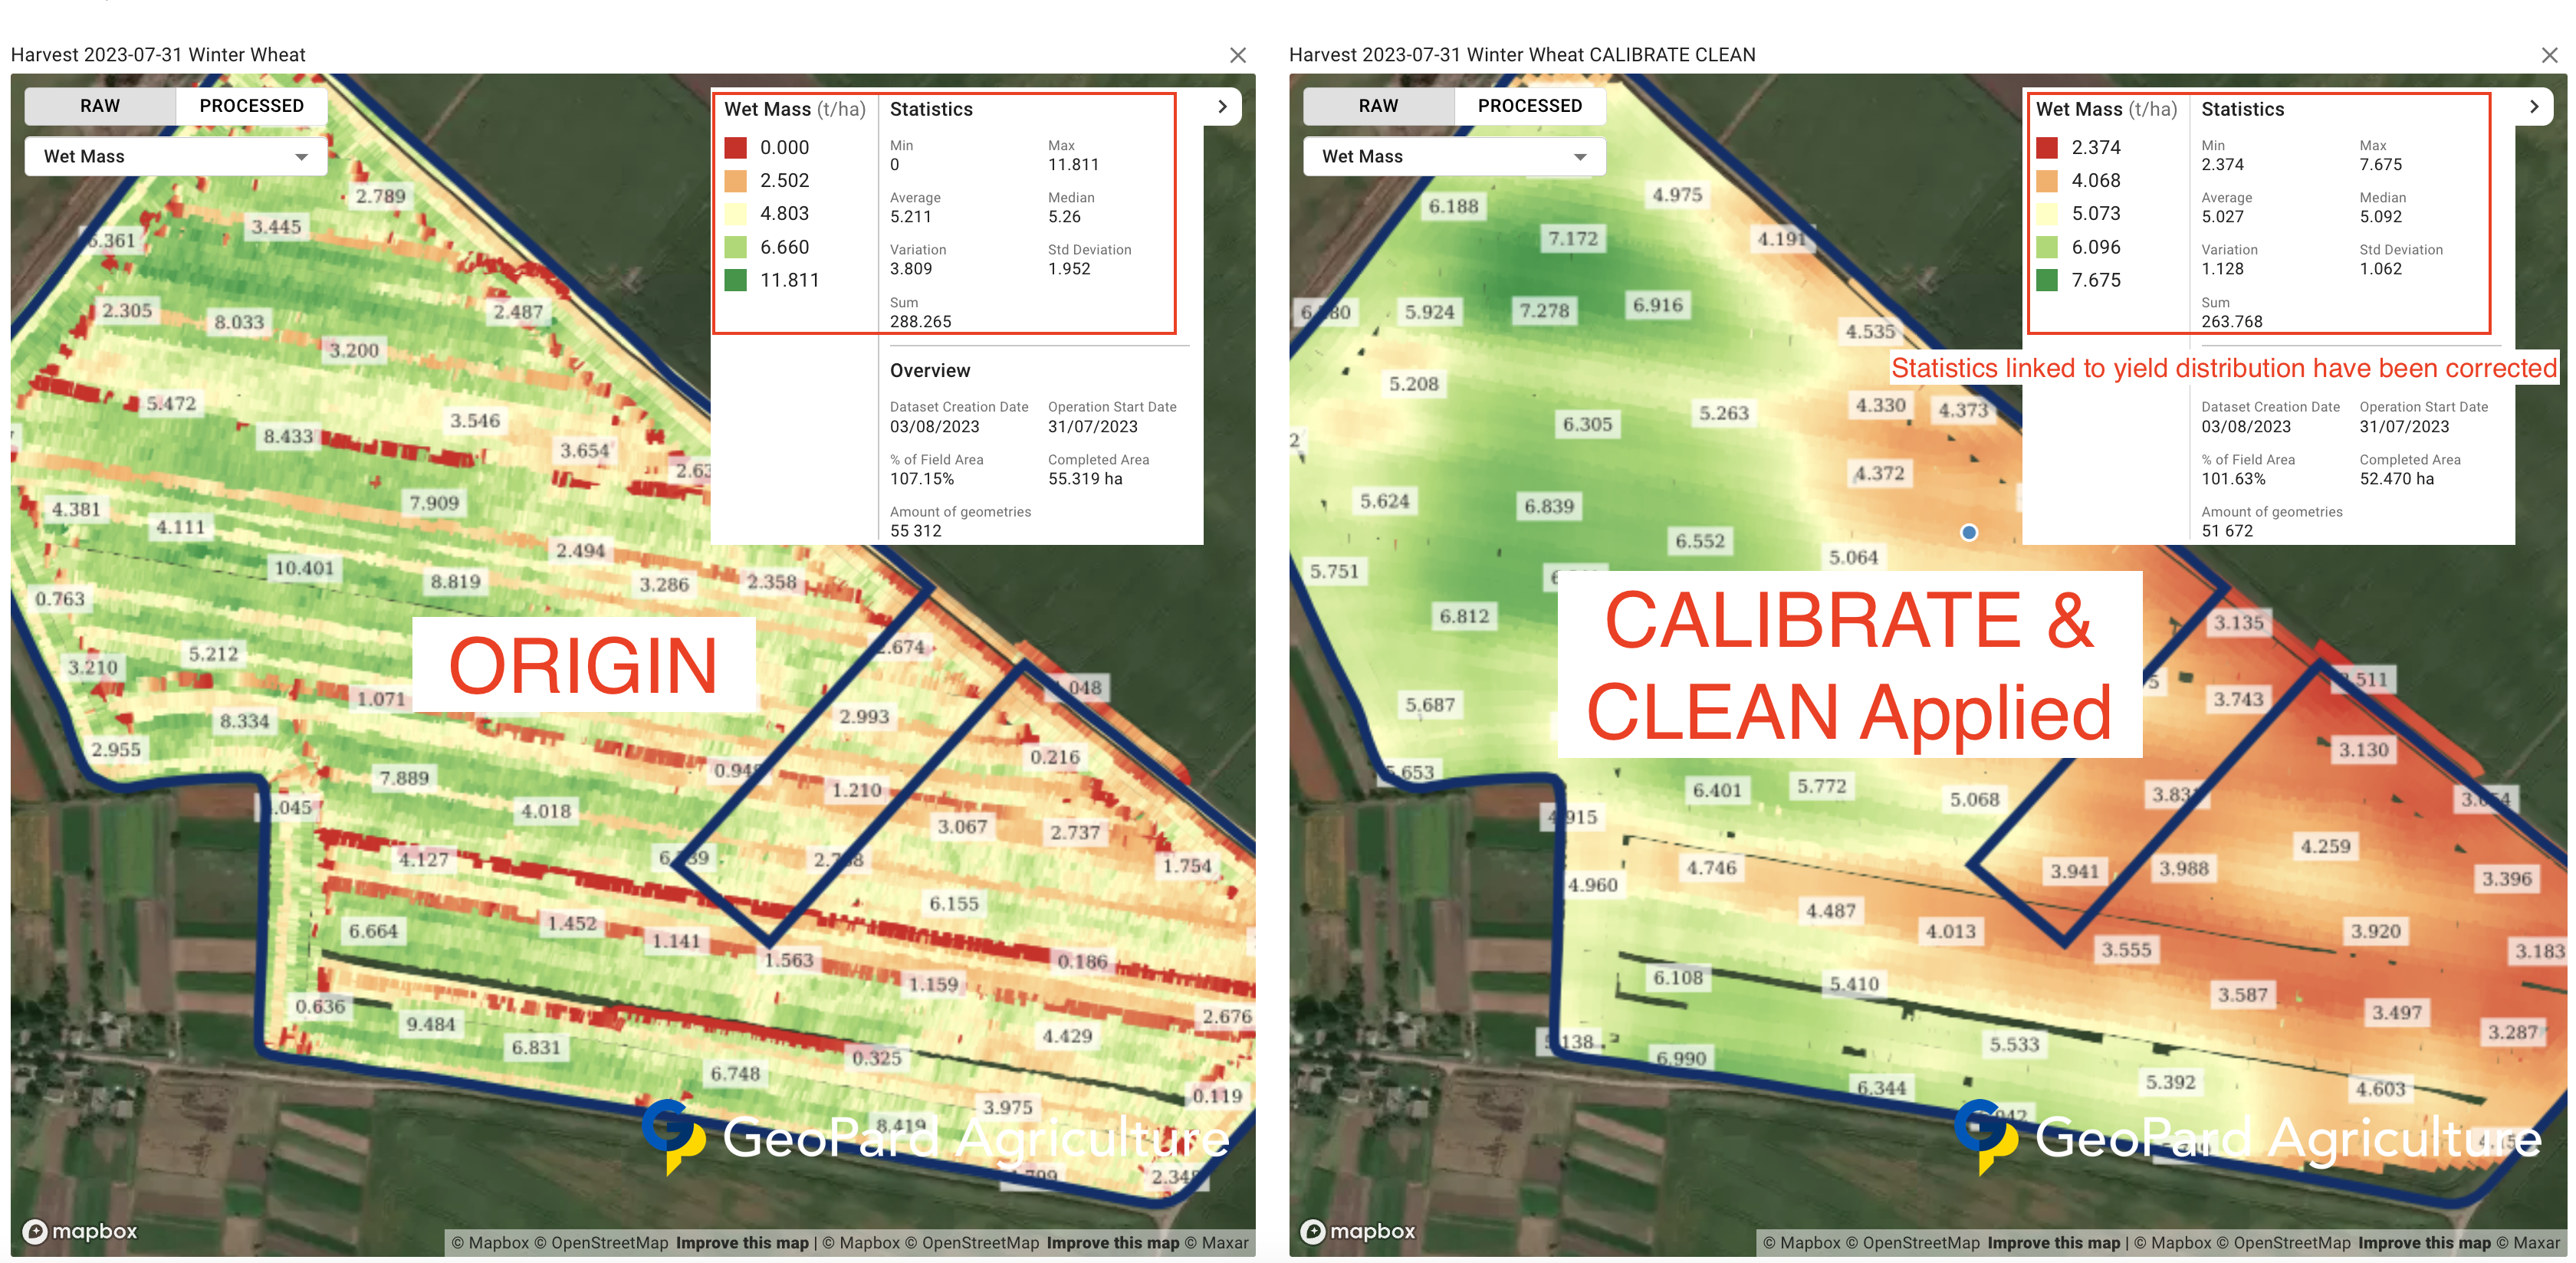
生の収量ファイルには、旋回、停止、スパイク、重複、圃場外の値が含まれることがよくあります。

GeoPard はこれらのアーティファクトを除去し、後続分析向けにデータセットを較正します。

<figure><img src="https://1993076779-files.gitbook.io/~/files/v0/b/gitbook-x-prod.appspot.com/o/spaces%2FYICBELdyAXXebKAzfLOR%2Fuploads%2F20oK9gntxkBPLitm5waW%2Fimage.png?alt=media&amp;token=dc4dc121-6e5e-41cf-8d72-515fe882663a" alt="Result after cleaning and calibration"><figcaption><p>クレンジングと較正後の結果。</p></figcaption></figure>

次のような場合に使用します:

* 外れ値とノイズを除去する
* 圃場境界でデータを切り取る
* 複数のコンバインや収穫日のデータを揃える
* 既知の平均値または総収量で全体の偏りを補正する
* USDA の収量クレンジングロジックを適用する

完全ガイドはこちら:

* [収量の較正とクレンジング](/geopard-tutorials/jpn/nong-xue/kurningu.md)

{% hint style="warning" %}
使用 **走行経路別較正** ストライプ状のムラが複数の機械や日による場合。

使用 **平均値または総量による較正** 圃場の合計が信頼できる場合。
{% endhint %}

### 4. 合成収量マップ

すべての収穫で完全な収量記録があるとは限りません。

データが欠落している、部分的である、または記録されていない場合に、合成収量マップが役立ちます。

<figure><img src="https://1993076779-files.gitbook.io/~/files/v0/b/gitbook-x-prod.appspot.com/o/spaces%2FYICBELdyAXXebKAzfLOR%2Fuploads%2FnEKqU70RiQEE0oxNKgls%2Fimage.png?alt=media&amp;token=e779ea7e-dc6b-45d0-8be6-4f320a5d600a" alt="Calibrated vs synthetic yield"><figcaption><p>較正済み収量と合成収量マップを比較します。</p></figcaption></figure>

<figure><img src="https://1993076779-files.gitbook.io/~/files/v0/b/gitbook-x-prod.appspot.com/o/spaces%2FYICBELdyAXXebKAzfLOR%2Fuploads%2Fz427malsrdHAQOCNjQyh%2Fimage.png?alt=media&amp;token=26a63983-2a7f-48b2-bfc9-3e40a883582a" alt="Synthetic yield dataset example"><figcaption><p>合成収量データセットの例。</p></figcaption></figure>

次のような場合に有効です:

* 古い収穫機に収量モニタがなかった
* 圃場の一部しか記録されていない
* 生データが損傷しすぎて、そのままでは信頼できない
* 圃場の平均収量または総収量しか分からない

合成収量は、圃場の過去の挙動とリモートセンシングのパターンを利用します。

次の用途にも使えます **部分復元**.

圃場の一部に使える収穫データがあり、別の部分が欠落またはノイズ過多の場合、GeoPard は不完全な領域を再構築して、より完全な収量データセットを作成できます。

<figure><img src="https://1993076779-files.gitbook.io/~/files/v0/b/gitbook-x-prod.appspot.com/o/spaces%2FYICBELdyAXXebKAzfLOR%2Fuploads%2F0seT3f3a7IV3lozI6BSj%2FGeoPard-restoring_partial_yield.gif?alt=media&amp;token=1b6eecac-ac0a-45ff-80ee-26dd89da4a5a" alt="Reconstruct partial harvesting dataset"><figcaption><p>部分的な収穫データセットの欠損部分を再構築します。</p></figcaption></figure>

詳細はこちら:

* [合成収量マップ](/geopard-tutorials/jpn/nong-xue/mappu-1.md)
* [衛星モニタリング](/geopard-tutorials/jpn/tsu-webapuri/monitaringu.md)

### 5. 収量データから推奨を作成

クレンジング済み収量データは、処方設計やシーズン後分析における最も強力な入力の 1 つです。

#### ゾーン

収量単独で使用することも、土壌レイヤーや施肥・散布済みレイヤーと組み合わせることもできます。

これは、生産性ゾーンや可変施用計画の一般的な方法です。

複数年にわたる複数の収量データセットからゾーニングを作成することもできます。

一般的なワークフローは次のとおりです:

* 各収量データセットをクレンジングして較正する
* 異なる年のデータセットを正規化または比較する
* 過去の収穫記録が欠けている場合は合成収量を含める
* 選択した収量レイヤーを 1 つのゾーニングワークフローに統合する

便利なページ:

* [土壌/収量/施用済みデータを使ったゾーンマップの作成](/geopard-tutorials/jpn/tsu-webapuri/znmapputo/matahadtawotteznmappuwo.md)
* [圃場管理ゾーン（生産性ゾーン）作成プロセス](/geopard-tutorials/jpn/nong-xue/znznnopurosesu.md)
* [収量データセットの比較](/geopard-tutorials/jpn/nong-xue/dtasettono.md)

#### 方程式

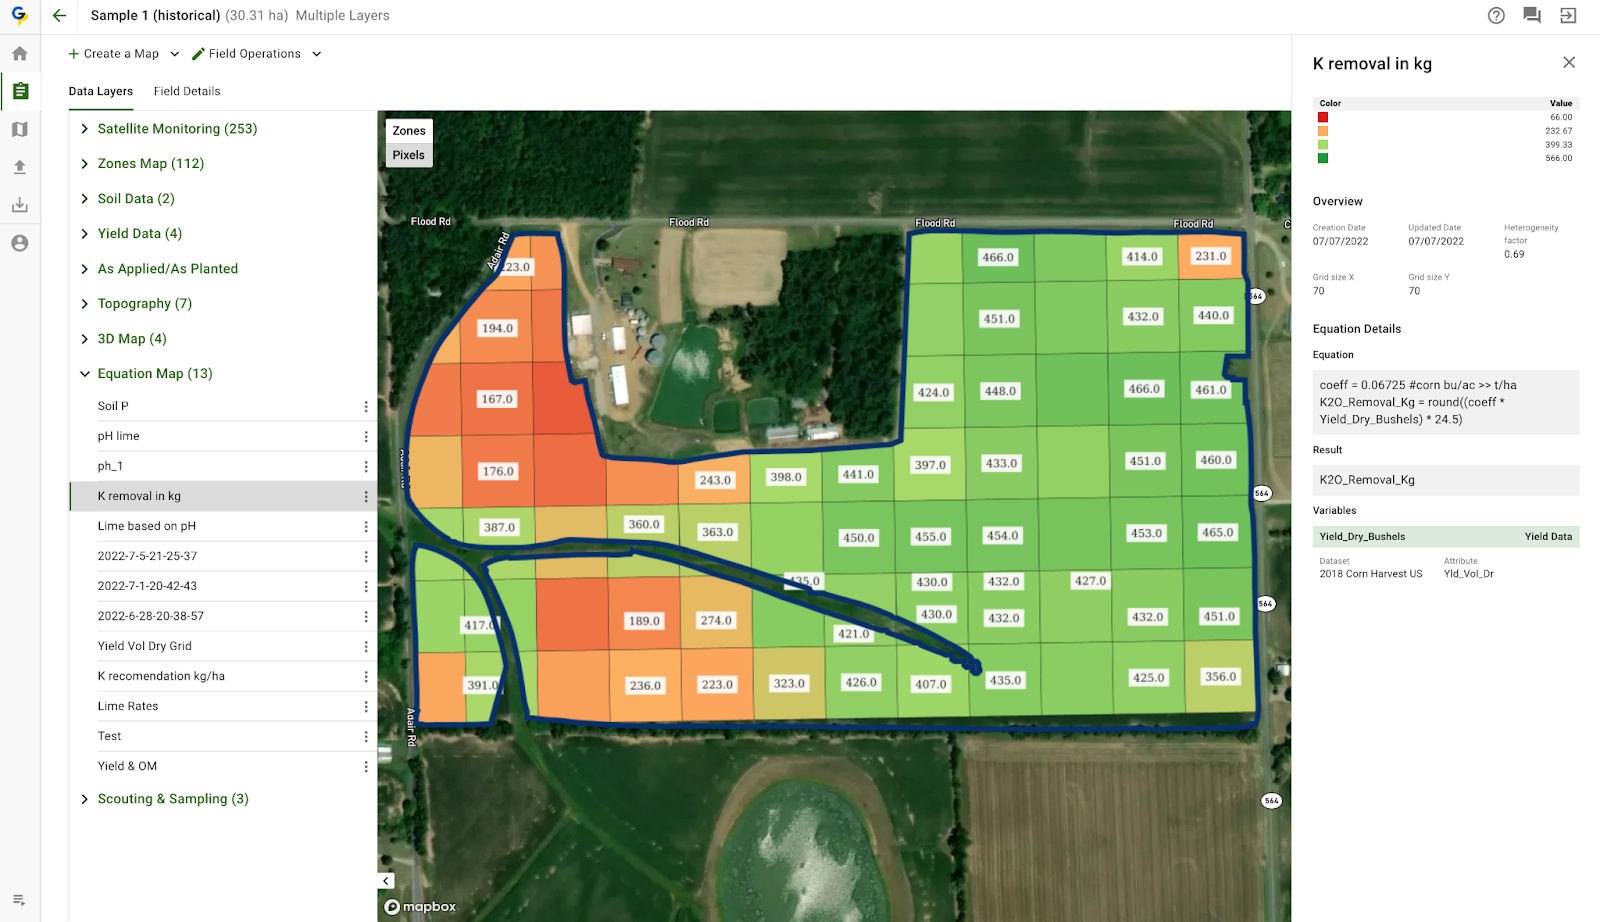
収量を方程式の中で、除去量、効率、ROI、類似性、カスタム分析に活用します。

* [方程式ベースの分析](/geopard-tutorials/jpn/tsu-webapuri/bsuno.md)
* [バッチ方程式分析](/geopard-tutorials/jpn/tsu-webapuri/bsuno/no.md)
* [窒素利用効率（NUE）と窒素吸収量](/geopard-tutorials/jpn/nong-xue/zhi-su-li-yong-xiaol-nue-zhi-su-xi-shou.md)

#### 養分吸収量に基づく VRA マップ

収量データは、養分除去量や養分吸収量のワークフローも支援できます。

実用例としては、作物の吸収ロジックから可変施肥の窒素マップを作成し、それを機械で使える処方箋としてエクスポートする方法があります。

<figure><img src="https://lh4.googleusercontent.com/GlMwn4wfmG_uCEh4YaAY7w8wMmZ-eqdVkS9y8gZr1GFxnS7SJX_oH7njtMadYROdlHRkmsqg69JEGGFl-m02gJhdipOKxaoyohJDuzo5lAdmsx3CEGc3jUbTgaakZZc1ZzL1IThM15urylg81hoYv3Fv_lfHK3Y3iYtNiOBMhEGBzKF_eoyV8QBcJQ" alt="Variable-rate nutrient uptake map example"><figcaption><p>収量データから導出した養分吸収量に基づく VRA マップの例。</p></figcaption></figure>

GeoPard は次を計算できます:

* **窒素吸収量（NU）**
* **窒素利用効率（NUE）**
* **窒素余剰（NS）**

これらの出力は、どこで作物がより多くの養分を持ち出したか、どこで窒素が未利用のまま残ったか、来季にどの地点で施用量を増減すべきかの把握に役立ちます。

以下の参考資料を使用してください:

* [窒素利用効率（NUE）と窒素吸収量](/geopard-tutorials/jpn/nong-xue/zhi-su-li-yong-xiaol-nue-zhi-su-xi-shou.md)
* [ユースケース: ジャガイモの可変施肥窒素（VRA）で収量を 5～10% 向上させる](/geopard-tutorials/jpn/nong-xue/ysuksu-jagaimokevrade510nowo.md)
* [ゾーンで可変レートを割り当てる（農業資材レート分配ツール）](/geopard-tutorials/jpn/tsu-webapuri/znmapputo/zndeworiterutsru.md)

#### 利益マップ

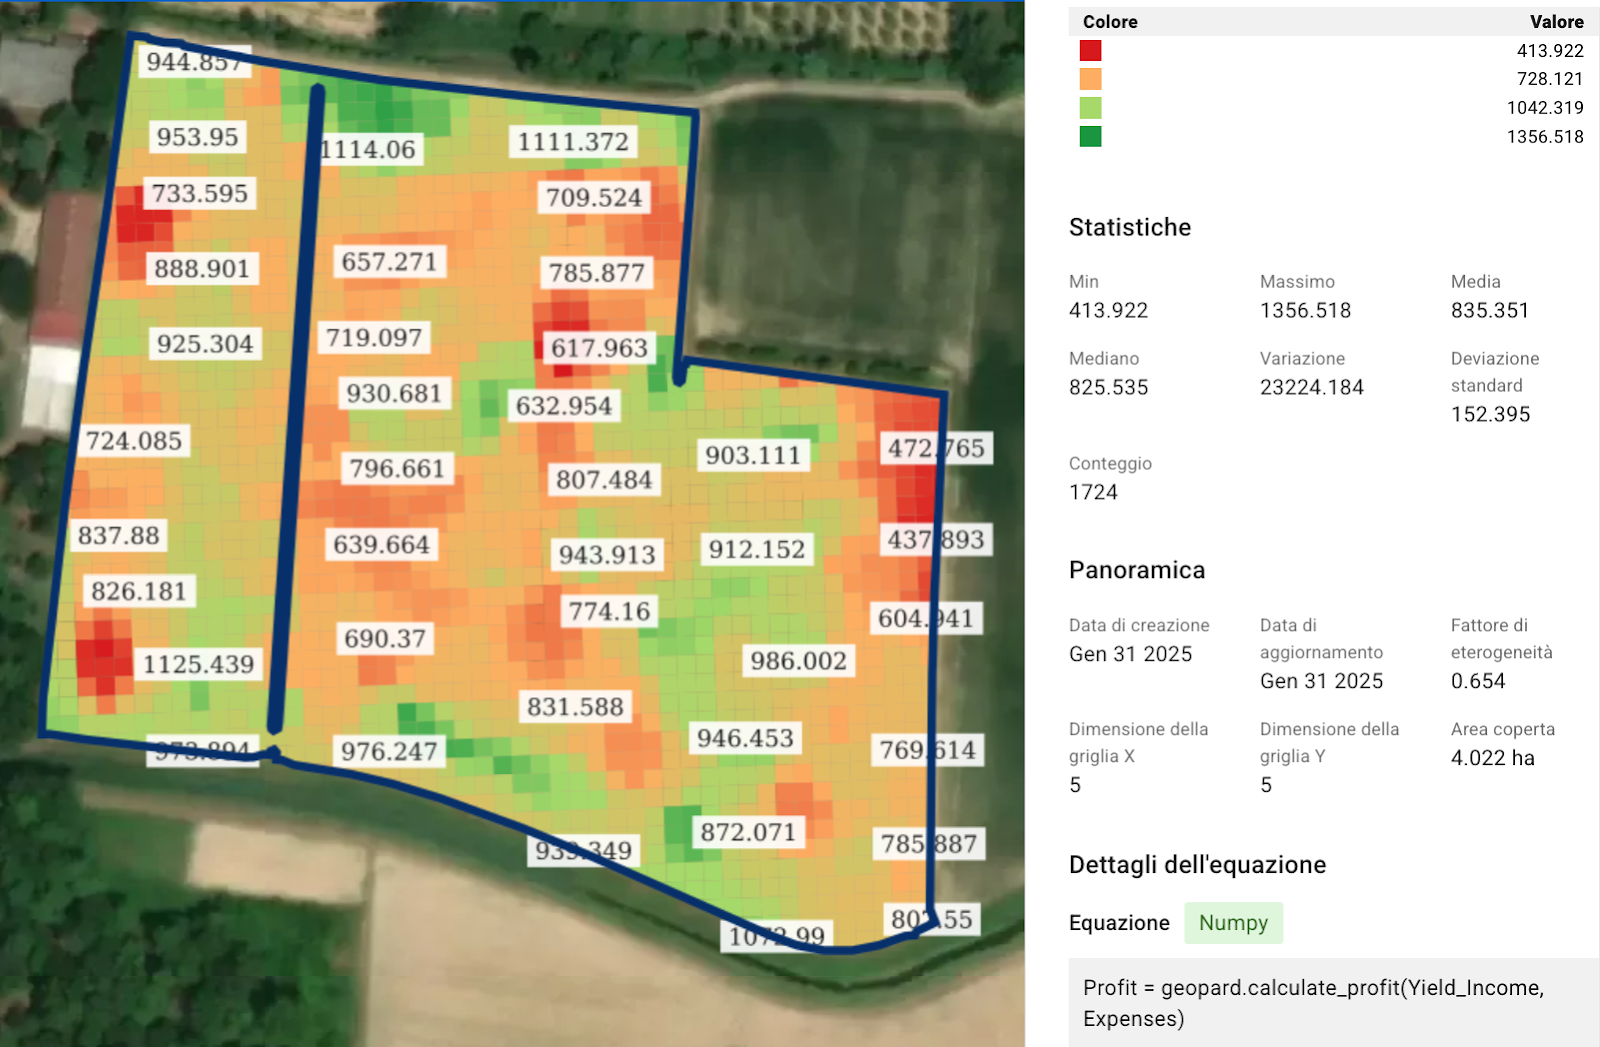
利益型ワークフローは、収量、価格、作業コストを組み合わせます。

1 圃場全体の平均値だけでなく、同じ圃場内の利益差を確認するために使います。

イタリアのディーラーワークフロー例では、GeoPard は VRA 実行と収穫レビュー後にゾーンごとの収量と収益性を比較します。

その例からの主なポイント:

* **ゾーン 2** が最も高い総利益と平均収量を示しました。
* **ゾーン 3** が最高の生産性に達し、 **20.42 t/ha**.
* **ゾーン 3** また、 **€1808.14/ha** の収益性を示しました。
* 利益マップは、利益率が高い場所と、コスト回収が難しい場所を示します。

<figure><img src="https://1993076779-files.gitbook.io/~/files/v0/b/gitbook-x-prod.appspot.com/o/spaces%2FYICBELdyAXXebKAzfLOR%2Fuploads%2F47XGTkAERSxGHMsIKxQ6%2F6.png?alt=media&amp;token=557d812b-784f-4d33-a208-157ef4e6ac47" alt="Profit map with high and low margin areas"><figcaption><p>高利益率・低利益率エリアを示す利益マップ。</p></figcaption></figure>

参考文献:

* [イタリアのディーラーワークフロー: John Deere Ops Center - GeoPard - VRA 窒素 - 試験区 - 利益マップ](/geopard-tutorials/jpn/nong-xue/itarianowkufur-john-deere-ops-center-geopard-vra-mappu.md)
* [GeoPard の利益マップの紹介: 精密農業における前進](https://geopard.tech/blog/introducing-geopards-profit-maps-a-step-forward-in-precision-agriculture/)

### 6. Yield Report で収穫結果を検証

収穫後のゾーン性能を検証するために Yield Report を使用します。

収量を処方量または施用済み量と比較します。収量反応、ゾーン経済性、次シーズンの対応を確認します。

<div><figure><img src="https://1993076779-files.gitbook.io/~/files/v0/b/gitbook-x-prod.appspot.com/o/spaces%2FYICBELdyAXXebKAzfLOR%2Fuploads%2FjfRXHkaTS72n8EWNW1bc%2Fyield-report-tab.png?alt=media&amp;token=f242bad8-8727-4d0d-99b2-f1432adddab7" alt=""><figcaption></figcaption></figure> <figure><img src="https://1993076779-files.gitbook.io/~/files/v0/b/gitbook-x-prod.appspot.com/o/spaces%2FYICBELdyAXXebKAzfLOR%2Fuploads%2FJhUbXX7KIE0yM624ixpO%2Fcompare-by-zones-2.png?alt=media&amp;token=514b76ba-7d6f-455a-b452-6b2136e39124" alt=""><figcaption></figcaption></figure></div>

* [収量レポート](/geopard-tutorials/jpn/nong-xue/repto-1.md)

### 7. 収量データを John Deere Ops Center に送信

実務上の方法は 3 つあります。

1 つ目は、John Deere からの収穫データを GeoPard にインポートする方法です。

2 つ目は、収量由来の出力をファイルまたはマップレイヤーとして John Deere に送り返す方法です。

3 つ目は、処理済み収量を次の形式でエクスポートする方法です **作業データ**.

を使用します **作業データ** このルートは、クレンジングまたは較正済みデータセットで、John Deere Operations Center に表示されているデータセットを置き換えたい場合に使用します。

圃場がすでに John Deere と連携している場合、その圃場上の新しい GeoPard アセットは Ops Center に同期できます。

<figure><img src="https://1993076779-files.gitbook.io/~/files/v0/b/gitbook-x-prod.appspot.com/o/spaces%2FYICBELdyAXXebKAzfLOR%2Fuploads%2F8dKxPmUmV4amrPsHjVS2%2FExport%20GeoPard%20Layer%20to%20John%20Deere%20as%20a%20Map%20Layer.png?alt=media&amp;token=97fa981e-9c01-4755-97ba-c30db4cb27ad" alt="Export layer to John Deere"><figcaption><p>GeoPard のレイヤーを John Deere Ops Center に送信します。</p></figcaption></figure>

以下のページを使用してください:

* [MyJohnDeere からのインポート](/geopard-tutorials/jpn/tsu-webapuri/dtanorimi/myjohndeerekararimu.md)
* [6. Rx マップを John Deere Operations Center にファイルとしてエクスポート](/geopard-tutorials/jpn/tsu-webapuri/john-deere-operations-center-lian-xie/6-mappuwofairutoshitejohn-deere-operations-centerheekusupto.md)
* [9. 土壌、地形、衛星、分析をマップレイヤーとしてエクスポート](/geopard-tutorials/jpn/tsu-webapuri/john-deere-operations-center-lian-xie/9-matahadtawomappureiytoshiteekusupto.md)

{% hint style="info" %}
John Deere 連携圃場では、GeoPard は処理済みレイヤーを運用データとして Ops Center に戻すこともできます。

これは、収量のクレンジングと較正後に、修正済みデータセットを John Deere の元の運用レイヤーと置き換えるべき場合に有効です。
{% endhint %}

### 関連ページ

* [収量データセットの比較](/geopard-tutorials/jpn/nong-xue/dtasettono.md)
* [収量データの表示](/geopard-tutorials/jpn/tsu-mobairuapuri/dtano-1.md)
* [作業ログ - エラー/インポートと分析の追跡](/geopard-tutorials/jpn/tsu-webapuri/rogu-errimiwo.md)


---

# Agent Instructions
This documentation is published with GitBook. GitBook is the documentation platform designed so that both humans and AI agents can read, navigate, and reason over technical content effectively. Learn more at gitbook.com.

## Querying This Documentation
If you need additional information that is not directly available in this page, you can query the documentation dynamically by asking a question.

Perform an HTTP GET request on the current page URL with the `ask` query parameter, and the optional `goal` query parameter:

```
GET https://docs.geopard.tech/geopard-tutorials/jpn/tsu-webapuri/dta.md?ask=<question>&goal=<endgoal>
```

`ask` is the immediate question: it should be specific, self-contained, and written in natural language.
`goal` is optional and describes the broader end goal you are ultimately trying to accomplish on behalf of the user. GitBook uses it to tailor the answer towards what is most useful for that goal.

The response will contain a direct answer to the question and relevant excerpts and sources from the documentation.

Use this mechanism when the answer is not explicitly present in the current page, you need clarification or additional context, or you want to retrieve related documentation sections.