> For the complete documentation index, see [llms.txt](https://docs.geopard.tech/geopard-tutorials/llms.txt). Markdown versions of documentation pages are available by appending `.md` to page URLs; this page is available as [Markdown](https://docs.geopard.tech/geopard-tutorials/jpn/rirsu/release-web-july-2024-equation-map-creation-spatially-localized-zones-seeding-and-application-work-p.md).

# Web版リリース 2024年7月（計算式マップの作成、空間的に位置づけられたゾーン、播種・散布作業計画）

方程式マップ作成の強化、空間的局在ゾーン、播種および散布Work Plan、バッチ分析用の衛星画像、John Deere連携とUIナビゲーションの改善。

### 方程式マップ作成時の入力オプションを拡充

GeoPardチームは、新機能を導入しました。 <mark style="background-color:yellow;">これにより、</mark> [<mark style="background-color:yellow;">既存の方程式マップ</mark>](https://docs.geopard.tech/geopard-tutorials/jpn/tsu-webapuri/equation-based-analytics.md#using-equation-maps-in-equations) <mark style="background-color:yellow;">と</mark> [<mark style="background-color:yellow;">ゾーンマップ</mark>](https://docs.geopard.tech/geopard-tutorials/jpn/tsu-webapuri/zones-maps-and-analytics.md) <mark style="background-color:yellow;">を新しい方程式マップの作成時に入力レイヤーとして使用できます</mark>。これらのマップをUIから直接選択できるため、計算に簡単に取り込めます。また、使用した方程式マップとゾーンマップの詳細情報も表示され、他のデータレイヤーと同様に、計算に関わるすべての変数を明確に確認できます。

{% @arcade/embed url="<https://app.arcade.software/share/zeuVyl91MfW5DD1ccgZn>" flowId="zeuVyl91MfW5DD1ccgZn" %}

### 空間局所化ゾーン分類を新たに追加

GeoPardチームは、新しい [空間局所化](https://docs.geopard.tech/pages/7bd713938a0211eb240105e422a323236a551c49#id-4.-spatially-localized-classification) 分類タイプを導入しました。土壌サンプリング、施肥、播種などの農作業で扱いやすいゾーンを作成できます。 <mark style="background-color:yellow;">この新しい分類方法では、データを地理空間的にクラスタリングし、圃場作業に適した、より小さく局所的なゾーンを作成します。</mark> 大きすぎるゾーンを避けることで、効率的で管理しやすいゾーンを作成できます。従来の分類では範囲が広すぎるという農業生産者からのフィードバックに対応しました。

<figure><img src="https://1993076779-files.gitbook.io/~/files/v0/b/gitbook-x-prod.appspot.com/o/spaces%2FYICBELdyAXXebKAzfLOR%2Fuploads%2Fh8ZUgUW63DCCUu6Dq5hI%2FGeoPard%20-%20Spatially%20Localized%20Soil%20Sampling%20Zones.png?alt=media&amp;token=c7b294d4-59d1-4b1e-a472-26a46a95e317" alt=""><figcaption><p>空間局所化ゾーンにより、圃場内のばらつきを詳細に管理するゾーンとグリッドサンプリングとのバランスを保てます。</p></figcaption></figure>

### 播種・散布作業計画をエクスポート

John Deereと同期する播種および散布の作業計画タイプを追加し、ゾーンマップをエクスポートする機能を拡張しました。 <mark style="background-color:yellow;">作業計画を</mark> [<mark style="background-color:yellow;">作成</mark>](https://docs.geopard.tech/geopard-tutorials/jpn/tsu-webapuri/john-deere-operations-center-integration/8.-export-rx-maps-to-john-deere-operations-center-as-work-plans.md) <mark style="background-color:yellow;">できるようになりました。方程式マップ／ゾーンマップのメニューまたは圃場ページ上部のパネルから直接作成できます</mark>。マップの用途に応じたオプションがあらかじめ選択されています。この更新により圃場計画を効率化でき、1つの計画に最大4種類の散布タイプを設定できます。単位は選択した面積単位に応じて自動調整されるため、作業の精度が高まります。

{% embed url="<https://youtu.be/op1o-Y3r6bg?si=cUQHzVwVvt-eFzFm>" %}
作業計画の機能概要
{% endembed %}

### 方程式マップの一括作成に衛星画像を利用

衛星画像を <mark style="background-color:yellow;">方程式マップの一括作成に使用</mark>できるようになりました。衛星画像を手動で選択できるため、分析に使う画像を一度に複数選べます。また、おすすめの画像も選択でき、一括処理でも単一の方程式マップ作成でも、ワークフローを最適化しやすくなります。

{% @arcade/embed url="<https://app.arcade.software/share/46vKyDt0WF0at9R34cRC>" flowId="46vKyDt0WF0at9R34cRC" %}

### John Deereのサブスクリプションで作業タイプを設定

新しい設定機能を導入し、 <mark style="background-color:yellow;">John Deereのサブスクリプションで収集する作業タイプを管理・確認</mark>できるようになりました。連携ページで、John Deere Operations Centerアカウントから自動収集するデータセットの種類（散布、収穫、播種など）を設定できます。選択した作業タイプは圃場作業セクションに表示され、組織一覧とあわせてサブスクリプションを簡単に管理できます。

{% @arcade/embed url="<https://app.arcade.software/share/nGqfugJnn03DuvvSSPSn>" flowId="nGqfugJnn03DuvvSSPSn" %}

### 利用できないJohn Deereアクションを表示

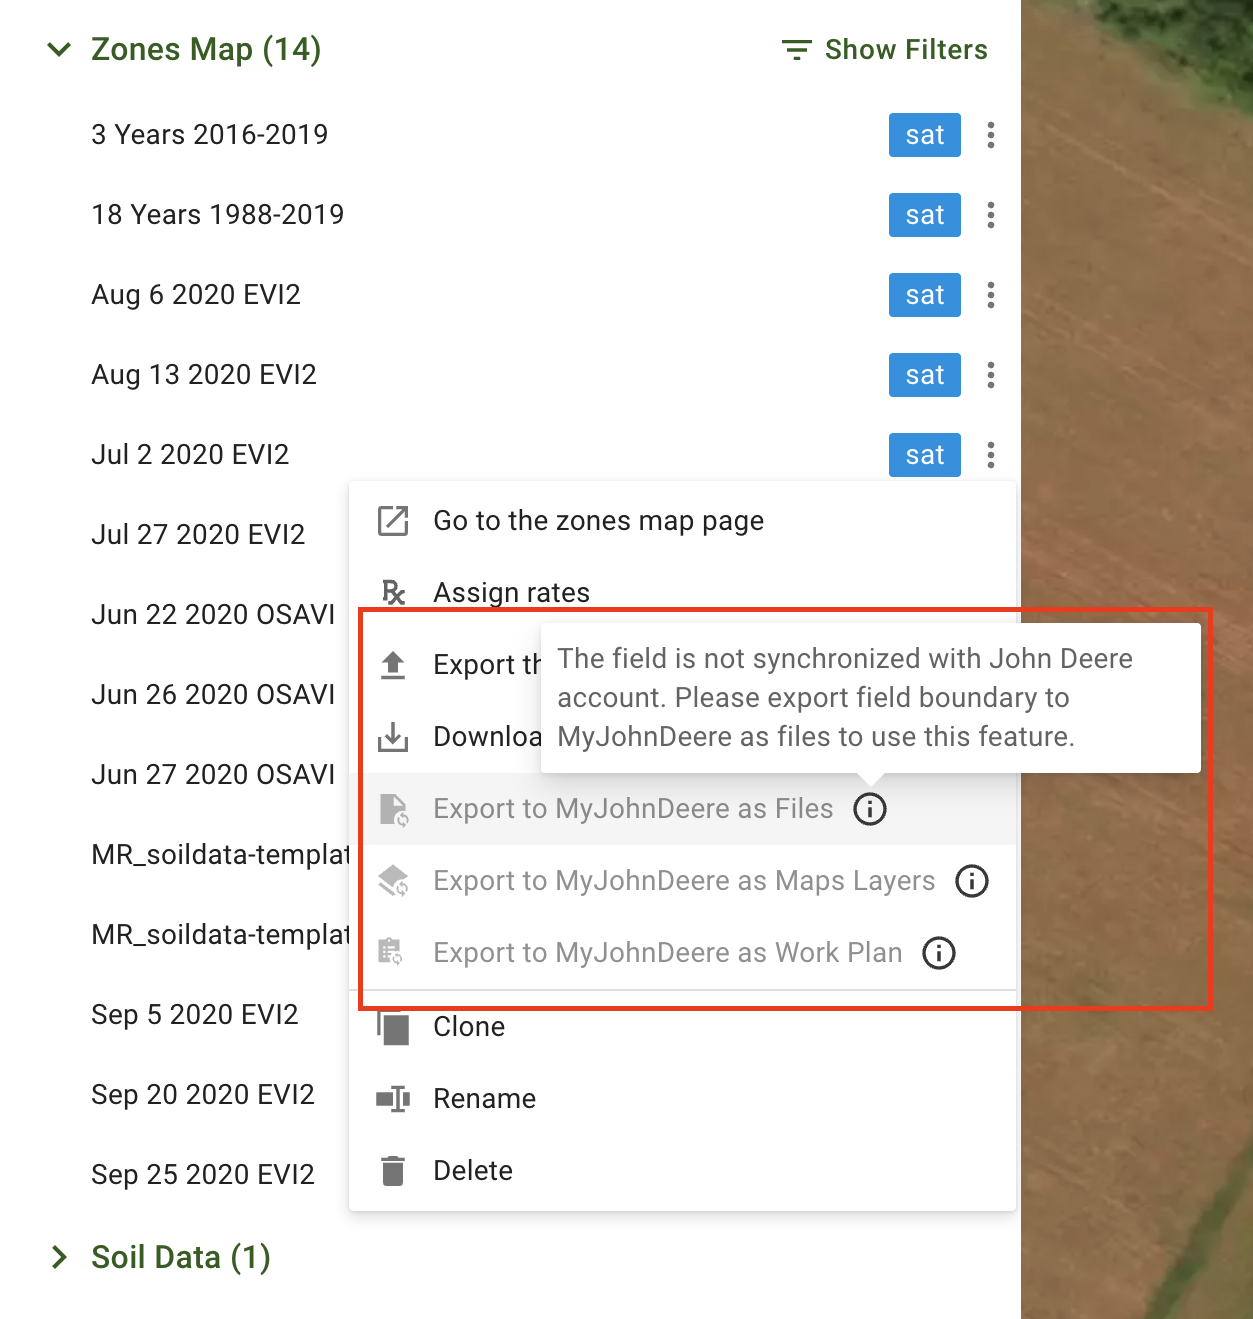
透明性を高めるため、利用できない場合も含め、すべてのJohn DeereアクションがUIに表示されるようになりました。「John Deereにマップレイヤーとしてエクスポート」などのアクションは、必要な条件が満たされていない場合、無効状態で表示されます。 <mark style="background-color:yellow;">アクションを利用可能にする方法を案内するツールチップも追加しました。機能を有効にするために必要な手順を確認できます</mark>.

<figure><img src="https://1993076779-files.gitbook.io/~/files/v0/b/gitbook-x-prod.appspot.com/o/spaces%2FYICBELdyAXXebKAzfLOR%2Fuploads%2FyfOX5nv1aAgN8eIJgcsv%2Fimage.png?alt=media&amp;token=ea42c4b0-4975-45b3-bad3-fff17d077032" alt="" width="563"><figcaption><p>利用できないJohn Deereアクションを表示</p></figcaption></figure>

### 統計ブロックから作業対象のゾーンを選択

「手動で描画」操作中にゾーン全体を選択しやすいよう、統計テーブルのゾーンをクリックできるようにしました。 <mark style="background-color:yellow;">「ポリゴンを結合」や「ポリゴンの色を変更」などのツールを使用する際、統計テーブルから複数のポリゴンを直接選択できます</mark>。選択したゾーンはマップとテーブルの両方でハイライト表示されるため、ゾーンの管理や編集が簡単になります。

<figure><img src="https://1993076779-files.gitbook.io/~/files/v0/b/gitbook-x-prod.appspot.com/o/spaces%2FYICBELdyAXXebKAzfLOR%2Fuploads%2FAJgDJnnOhvYXJq6jELtK%2Fstatistics_selection.gif?alt=media&amp;token=611a8f74-d96c-4bec-821e-943e6237ed2e" alt=""><figcaption><p>統計ブロックから作業対象のゾーンを選択</p></figcaption></figure>

### アップロード画面にファイル形式を表示

アップロードしたファイルの <mark style="background-color:yellow;">種類を識別しやすくするため、アップロード画面にファイル形式ラベルを追加しました</mark>。ファイル名の横に表示されるこのラベルで、アップロードしたデータの種類をすばやく確認できます。

<figure><img src="https://1993076779-files.gitbook.io/~/files/v0/b/gitbook-x-prod.appspot.com/o/spaces%2FYICBELdyAXXebKAzfLOR%2Fuploads%2Fnz8RfbG59dAgrrNOVsei%2FScreenshot%202024-08-23%20at%2011.32.04.png?alt=media&amp;token=7c77fd92-7d2b-418a-8df3-cfbbf0882e2f" alt="" width="563"><figcaption><p>アップロード画面にファイル形式を表示</p></figcaption></figure>

### タイルサイズを最適化して描画を高速化

アセットの種類に応じて <mark style="background-color:yellow;">タイルの描画を高速化</mark> するため、複数のタイルサイズを適用しました。この最適化により読み込み時間が短縮され、さまざまなアセットを扱う際の動作がよりスムーズになります。

<figure><img src="https://1993076779-files.gitbook.io/~/files/v0/b/gitbook-x-prod.appspot.com/o/spaces%2FYICBELdyAXXebKAzfLOR%2Fuploads%2FOwyt8No7AVgAIJ9R4tGf%2Ftile_sizes.gif?alt=media&amp;token=17b00216-db0f-44d1-9b78-a9c82c87216a" alt=""><figcaption><p>タイルサイズを最適化して描画を高速化</p></figcaption></figure>

### ドロップダウンメニューにアイコンを追加して操作性を向上

アプリ全体のドロップダウンメニューにアイコンを追加し、 <mark style="background-color:yellow;">メニュー項目を見分けやすく</mark> しました。視認性が向上し、目的のオプションをすばやく識別して選択できます。

<figure><img src="https://1993076779-files.gitbook.io/~/files/v0/b/gitbook-x-prod.appspot.com/o/spaces%2FYICBELdyAXXebKAzfLOR%2Fuploads%2FPeQrXcJ7Bf0bQ23IhhDA%2Fimage.png?alt=media&amp;token=02ccbea6-5709-41cc-9c38-8ce1cb354867" alt="" width="563"><figcaption></figcaption></figure>

### その他の機能改善と修正

* **選択上限のハイライト表示：** アセットツリーで選択上限に達したことがハイライト表示されるため、選択内容を管理しやすくなりました。
* **組織の自動展開：** 一覧の最初の組織が自動的に展開され、すばやくアクセスできるようになりました。
* **変数取得の改善：** 新しく生成された数式マップで必要な変数が正しく取得され、よりスムーズに動作するようになりました。
* **衛星画像選択の改善：** バッチ分析での衛星画像選択が改善され、使いやすくなりました。
* **変数更新の精度向上：** 数式ベースのフローに変更を加えた後も変数が正しく更新され、不整合が発生しなくなりました。
* **属性検索の修正：** 検索結果が重複して表示される問題を修正し、正確な検索結果が得られるようになりました。
* **カスタム数式の保存：** 一部のユーザーがカスタム数式を保存できない問題を解決しました。
* **イベント集約の改善：** Zones Mapsのイベントがより効果的に集約され、ユーザーエクスペリエンスが向上しました。

<mark style="background-color:yellow;">内部的な更新として、エラーログの改善、未使用コードの削除、GeoPardの各種機能に対する自動テスト範囲の拡充を行いました。</mark>


---

# Agent Instructions
This documentation is published with GitBook. GitBook is the documentation platform designed so that both humans and AI agents can read, navigate, and reason over technical content effectively. Learn more at gitbook.com.

## Querying This Documentation
If you need additional information that is not directly available in this page, you can query the documentation by asking a question.

Perform an HTTP GET request on the following URL with the `ask` and `goal` query parameters:

```
GET https://docs.geopard.tech/geopard-tutorials/jpn/rirsu/release-web-july-2024-equation-map-creation-spatially-localized-zones-seeding-and-application-work-p.md?ask=<question>&goal=<user_goal>
```

`ask` is the immediate question: it should be specific, self-contained, and written in natural language.
`goal` is what the user is ultimately trying to achieve, the reason they need the answer. Sharing it helps GitBook give you a better, more relevant answer. A goal is most helpful when it describes the outcome the user wants rather than restating the question. For example, with `ask=how do I create an API token`, a goal like `automate deployments from our CI pipeline` lets GitBook tailor the answer to that use case.

The response will contain a direct answer to the question and relevant excerpts and sources from the documentation.

Use this mechanism when the answer is not explicitly present in the current page, you need clarification or additional context, or you want to retrieve related documentation sections.