> For the complete documentation index, see [llms.txt](https://docs.geopard.tech/geopard-tutorials/llms.txt). Markdown versions of documentation pages are available by appending `.md` to page URLs; this page is available as [Markdown](https://docs.geopard.tech/geopard-tutorials/jpn/nong-xue/seeding/variable-rate-seeding-planting-maps.md).

# 可変播種量マップの作成方法

GeoPardで可変播種量マップを作成する4つの方法を紹介します。複数年の画像データから収量、土壌、地形まで、作物ごとの播種量の範囲設定や播種機へのエクスポートも解説します。

最も手早く可変播種マップを作成するには、複数年の衛星画像を活用します。GeoPardが代表的な年を選び、圃場ポテンシャルゾーンを作成したら、ゾーンごとに播種量を設定します。収量データ、土壌スキャン、地形データがあれば追加すると、作物の生育状況だけにとどまらないマップを作成できます。トウモロコシでは収量の高い圃場ほど播種量を増やし、大豆や小粒穀物では反応が逆になることが多いため、種子会社の推奨事項を確認してください。

{% hint style="info" %}
geopard.techのインタラクティブな可変播種のページをご覧ください： [可変播種](https://geopard.tech/variable-rate-seeding/)
{% endhint %}

{% hint style="success" %}
播種機用の播種処方箋を作成： [無料で始める](https://app.geopard.tech/auth/sign-up?utm_source=docs\&utm_medium=cta\&utm_campaign=variable-rate-seeding-planting-maps)
{% endhint %}

## 概要

可変播種（VRS）マップ、または可変播種マップは、圃場固有の条件に基づいて播種戦略を最適化するうえで欠かせません。VRSマップを適切に設定すると、作物の収量と資源効率を大幅に高められます。このガイドでは、GeoPardの精密農業ツールを使って効果的なVRSマップを作成するための主なポイントと選択肢を説明します。詳しくは、 [GeoPardブログの「可変播種」](https://geopard.tech/blog/variable-rate-seeding-how-does-it-work).

## VRSマップの設定オプション

VRSマップにおすすめの設定をいくつか紹介します。

### **1. 画像のみを使った圃場ポテンシャル**

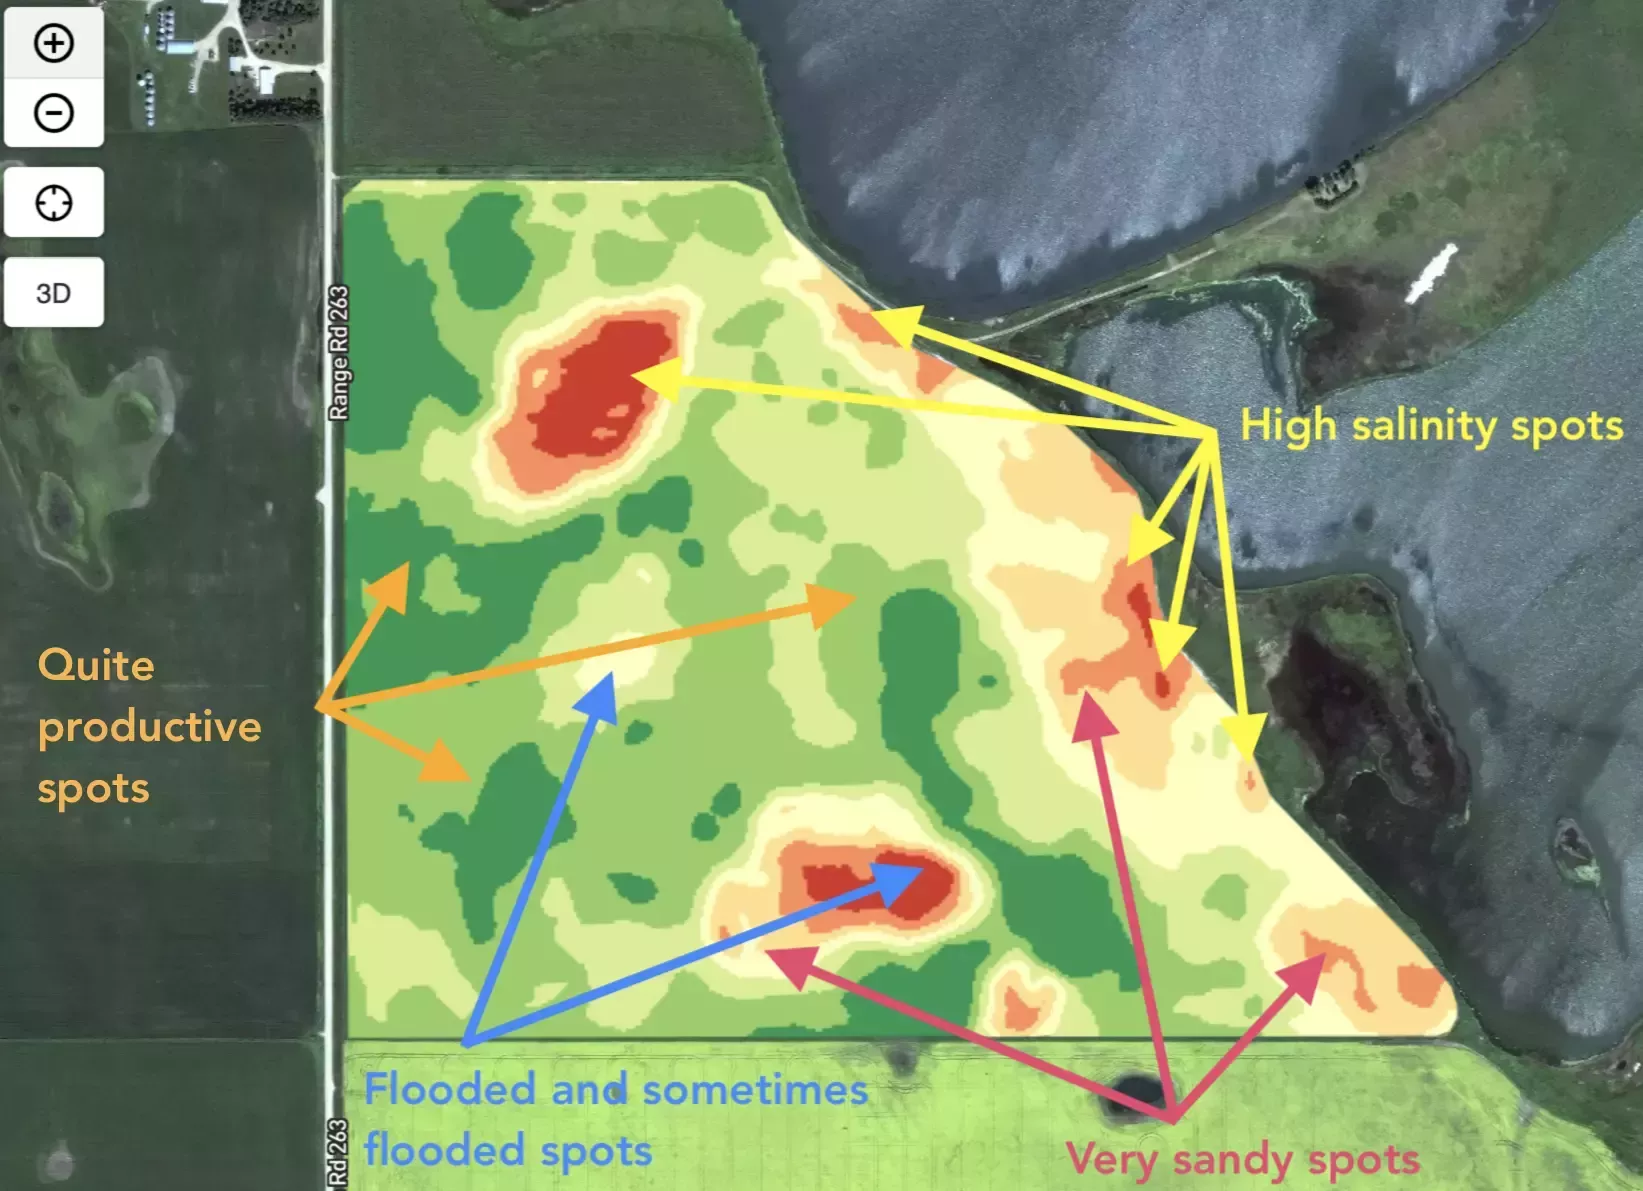
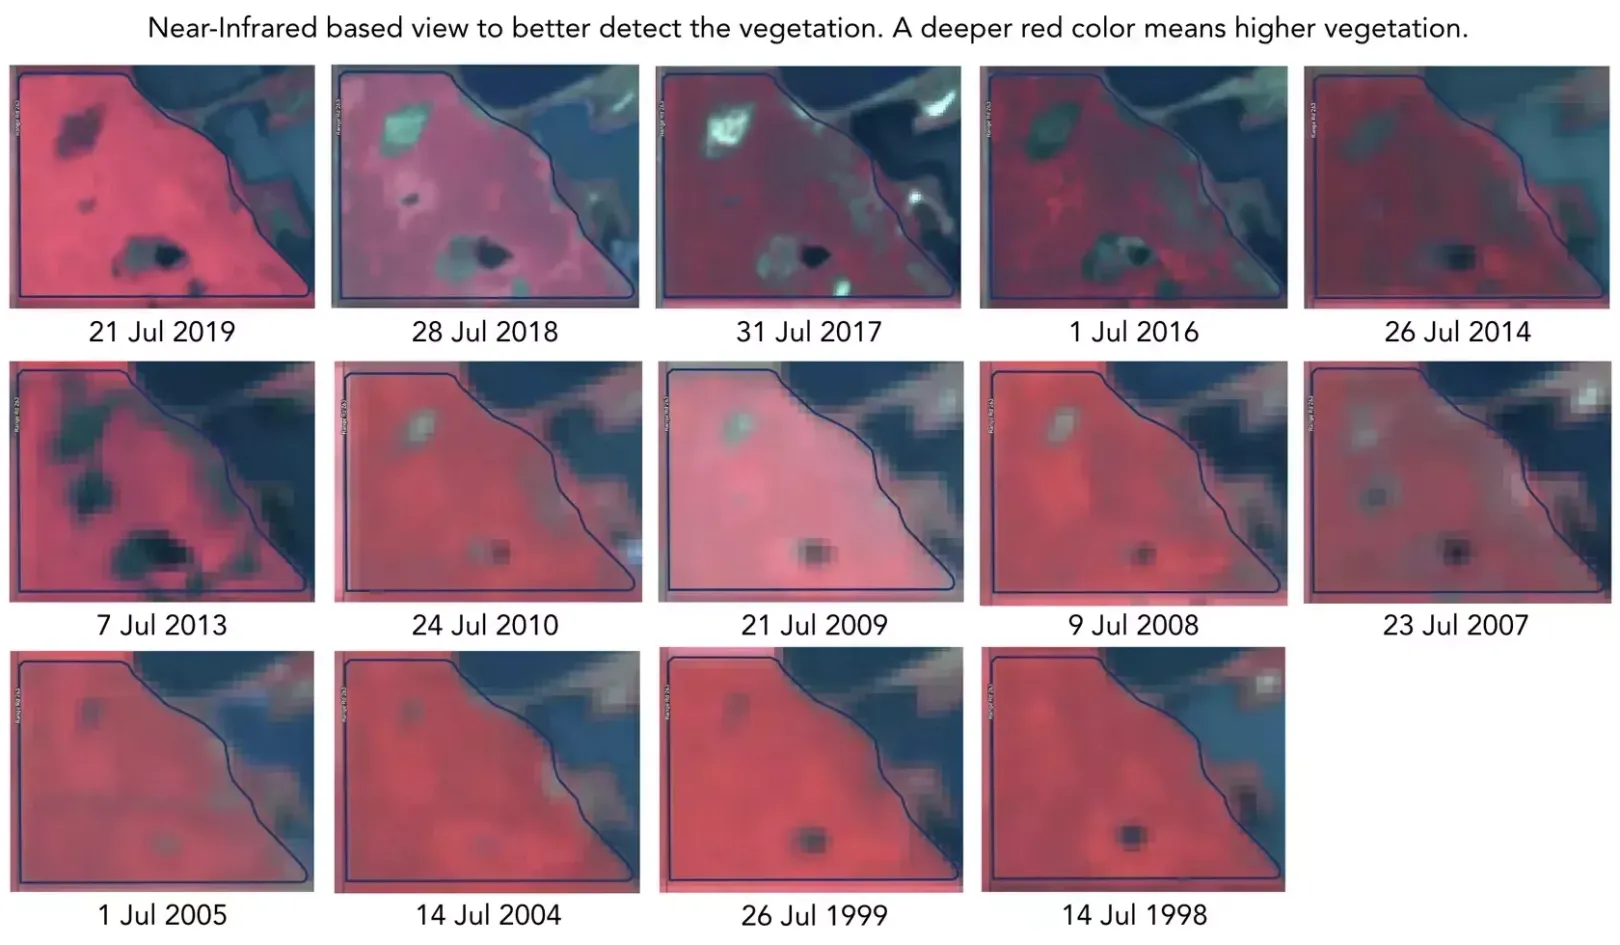
* **説明**：過去の画像を使って、以下に基づく可変播種（VRS）マップを作成します。 [圃場ポテンシャルマップ](https://geopard.tech/blog/field-potential-maps-yield-data/)。GeoPardの自動推奨システムが代表的な年の特定を支援します。翌シーズンの天候を予測するのは難しいため、外れ値となる年（たとえば、極端な乾燥年と多雨年のバランスを取る）を補正し、より正確な推奨を提示します。 [GeoPardによる代表年の自動推奨](https://geopard.tech/blog/r8yc32d9jc-multi-year-zones/).

<figure><img src="https://1993076779-files.gitbook.io/~/files/v0/b/gitbook-x-prod.appspot.com/o/spaces%2FYICBELdyAXXebKAzfLOR%2Fuploads%2FFHqjMwbCRSPrqnfb7Nc9%2Fimage.png?alt=media&amp;token=f6c1f474-1d25-4fce-97b9-2a190c93e423" alt=""><figcaption><p>GeoPardは画像を自動選択しますが、必要に応じて別の画像を選ぶこともできます</p></figcaption></figure>

<figure><img src="https://1993076779-files.gitbook.io/~/files/v0/b/gitbook-x-prod.appspot.com/o/spaces%2FYICBELdyAXXebKAzfLOR%2Fuploads%2FITUrv5FwXpcmr6qxOKse%2Fimage.png?alt=media&amp;token=7e5fa54d-bbb4-4deb-90d9-781b393e84ac" alt=""><figcaption><p>複数年の画像に基づいて自動作成された、可変播種に利用する圃場ポテンシャルゾーン</p></figcaption></figure>

* **おすすめの用途：** すぐに始めたい場合、特に輪作情報がある場合に適しています。同じ作物を栽培した年を選んでください（例：トウモロコシの播種にはトウモロコシを栽培した年）。

### **2. 画像、地形、土壌の明るさを使った圃場ポテンシャル**

* **説明：** この [多層アプローチ](https://docs.geopard.tech/geopard-tutorials/jpn/tsu-webapuri/zones-maps-and-analytics/multi-layer-analytics.md) では、画像、地形、 [土壌の明るさ](https://geopard.tech/blog/how-the-soil-brightness-index-enables-sustainable-agriculture/).
* **を組み合わせます。設定：** 侵食リスクを考慮して傾斜に負の重みを設定し、また有機物が少ないことを示す土壌の明るさが高い場合にも負の重みを設定します。

### **3. 収量、土壌サンプリング／スキャン、画像、地形、土壌の明るさを使った圃場ポテンシャル**

<figure><img src="https://1993076779-files.gitbook.io/~/files/v0/b/gitbook-x-prod.appspot.com/o/spaces%2FYICBELdyAXXebKAzfLOR%2Fuploads%2FrfxM1lvXMqXgHLGug8Ow%2FGeoPard%20Multi-Layer%20Maps%20creating%20-%20result%20map.png?alt=media&amp;token=78d3bfd6-255b-477b-95d5-6bb0de84da61" alt=""><figcaption><p>電気伝導度、地形、収量、衛星画像に基づく可変播種マップの例</p></figcaption></figure>

* **説明：** 複数のデータソースを統合し、包括的な圃場ポテンシャルマップを作成します。
* **手順：**
  1. [**収量データをクリーニングして補正する**](https://docs.geopard.tech/geopard-tutorials/jpn/nong-xue/yield-and-trials/yield-calibration-and-cleaning.md)：過去の収量データの精度を確保します。
  2. **作成する** [**合成収量マップ**](https://docs.geopard.tech/geopard-tutorials/jpn/nong-xue/yield-and-trials/synthetic-yield-map.md)：過去のシーズンの収量データがない場合は、GeoPardを使ってマップを作成します。必要なのは総収量または平均収量のみで、精度は約90%です。

### **4. 播種のための方程式ベースのアプローチ**

<figure><img src="https://1993076779-files.gitbook.io/~/files/v0/b/gitbook-x-prod.appspot.com/o/spaces%2FYICBELdyAXXebKAzfLOR%2Fuploads%2F1twMhOEPRFkgVH4WRpqK%2FScreenshot%202024-07-12%20at%2015.09.40.png?alt=media&amp;token=626677d3-375d-4b90-a262-c13cfe0cb3a2" alt=""><figcaption><p>収量データセットに基づく大豆の可変播種マップの例</p></figcaption></figure>

* **説明：** [カスタマイズした数式](https://geopard.tech/blog/equation-based-analytics-precision/) と、利用可能なデータレイヤー（画像、地形、収量、土壌など）を活用します。
* **柔軟性：** 個別の農学的ニーズに応じて設定を調整できます。
* こちらでも利用できます： [バッチ方程式分析](https://docs.geopard.tech/geopard-tutorials/jpn/tsu-webapuri/equation-based-analytics/batch-equation-analytics.md)

## 可変播種の推奨表

以下は、複数の国における各種作物の播種推奨をまとめた表です。

播種量の推奨値は、米国とカナダではエーカー当たりの種子数、その他の国ではヘクタール当たりの種子数で示しています。

<table><thead><tr><th width="146">作物</th><th width="122">国</th><th>播種量（種子数／エーカー）</th><th>播種量（粒/ヘクタール）</th></tr></thead><tbody><tr><td><strong>トウモロコシ</strong></td><td>米国</td><td>28,000 - 34,000</td><td></td></tr><tr><td></td><td>カナダ</td><td>28,000 - 34,000</td><td></td></tr><tr><td></td><td>ウクライナ</td><td></td><td>65,000 - 75,000</td></tr><tr><td></td><td>ブラジル</td><td></td><td>60,000 - 70,000</td></tr><tr><td></td><td>オーストラリア</td><td></td><td>70,000 - 85,000</td></tr><tr><td></td><td>ドイツ</td><td></td><td>70,000 - 85,000</td></tr><tr><td></td><td>フランス</td><td></td><td>70,000 - 85,000</td></tr><tr><td><strong>小麦</strong></td><td>米国</td><td>1,000,000 - 1,300,000</td><td></td></tr><tr><td></td><td>カナダ</td><td>1,000,000 - 1,300,000</td><td></td></tr><tr><td></td><td>ウクライナ</td><td></td><td>4,000,000 - 5,000,000</td></tr><tr><td></td><td>ブラジル</td><td></td><td>3,500,000 - 4,500,000</td></tr><tr><td></td><td>オーストラリア</td><td></td><td>4,000,000 - 5,000,000</td></tr><tr><td></td><td>ドイツ</td><td></td><td>4,000,000 - 5,000,000</td></tr><tr><td></td><td>フランス</td><td></td><td>4,000,000 - 5,000,000</td></tr><tr><td><strong>大豆</strong></td><td>米国</td><td>140,000 - 180,000</td><td></td></tr><tr><td></td><td>カナダ</td><td>140,000 - 180,000</td><td></td></tr><tr><td></td><td>ウクライナ</td><td></td><td>350,000 - 450,000</td></tr><tr><td></td><td>ブラジル</td><td></td><td>300,000 - 400,000</td></tr><tr><td></td><td>オーストラリア</td><td></td><td>350,000 - 450,000</td></tr><tr><td></td><td>ドイツ</td><td></td><td>350,000 - 450,000</td></tr><tr><td></td><td>フランス</td><td></td><td>350,000 - 450,000</td></tr><tr><td><strong>ヒマワリ</strong></td><td>米国</td><td>15,000 - 22,000</td><td></td></tr><tr><td></td><td>カナダ</td><td>15,000 - 22,000</td><td></td></tr><tr><td></td><td>ウクライナ</td><td></td><td>55,000 - 65,000</td></tr><tr><td></td><td>ブラジル</td><td></td><td>50,000 - 60,000</td></tr><tr><td></td><td>オーストラリア</td><td></td><td>50,000 - 60,000</td></tr><tr><td></td><td>ドイツ</td><td></td><td>50,000 - 60,000</td></tr><tr><td></td><td>フランス</td><td></td><td>50,000 - 60,000</td></tr><tr><td><strong>カノーラ（菜種）</strong></td><td>米国</td><td>500,000 - 800,000</td><td></td></tr><tr><td></td><td>カナダ</td><td>500,000 - 800,000</td><td></td></tr><tr><td></td><td>ウクライナ</td><td></td><td>350,000 - 450,000</td></tr><tr><td></td><td>ブラジル</td><td></td><td>2,200,000 - 3,500,000</td></tr><tr><td></td><td>オーストラリア</td><td></td><td>1,200,000 - 2,000,000</td></tr><tr><td></td><td>ドイツ</td><td></td><td>1,200,000 - 2,000,000</td></tr><tr><td></td><td>フランス</td><td></td><td>1,200,000 - 2,000,000</td></tr><tr><td><strong>サトウキビ</strong></td><td>米国</td><td>8,000 - 12,000</td><td></td></tr><tr><td></td><td>カナダ</td><td>該当なし</td><td></td></tr><tr><td></td><td>ウクライナ</td><td>該当なし</td><td></td></tr><tr><td></td><td>ブラジル</td><td></td><td>100,000 - 140,000</td></tr><tr><td></td><td>オーストラリア</td><td></td><td>100,000 - 140,000</td></tr><tr><td></td><td>ドイツ</td><td>該当なし</td><td></td></tr><tr><td></td><td>フランス</td><td>該当なし</td><td></td></tr><tr><td><strong>大麦</strong></td><td>米国</td><td>1,000,000 - 1,300,000</td><td></td></tr><tr><td></td><td>カナダ</td><td>1,000,000 - 1,300,000</td><td></td></tr><tr><td></td><td>ウクライナ</td><td></td><td>4,000,000 - 5,000,000</td></tr><tr><td></td><td>ブラジル</td><td></td><td>3,500,000 - 4,500,000</td></tr><tr><td></td><td>オーストラリア</td><td></td><td>2,500,000 - 3,200,000</td></tr><tr><td></td><td>ドイツ</td><td></td><td>4,000,000 - 5,000,000</td></tr><tr><td></td><td>フランス</td><td></td><td>4,000,000 - 5,000,000</td></tr><tr><td><strong>稲</strong></td><td>米国</td><td>100,000 - 150,000</td><td></td></tr><tr><td></td><td>カナダ</td><td>該当なし</td><td></td></tr><tr><td></td><td>ウクライナ</td><td>該当なし</td><td></td></tr><tr><td></td><td>ブラジル</td><td></td><td>400,000 - 600,000</td></tr><tr><td></td><td>オーストラリア</td><td></td><td>250,000 - 370,000</td></tr><tr><td></td><td>ドイツ</td><td>該当なし</td><td></td></tr><tr><td></td><td>フランス</td><td>該当なし</td><td></td></tr><tr><td><strong>綿花</strong></td><td>米国</td><td>45,000 - 55,000</td><td></td></tr><tr><td></td><td>カナダ</td><td>該当なし</td><td></td></tr><tr><td></td><td>ウクライナ</td><td>該当なし</td><td></td></tr><tr><td></td><td>ブラジル</td><td></td><td>100,000 - 120,000</td></tr><tr><td></td><td>オーストラリア</td><td></td><td>110,000 - 135,000</td></tr><tr><td></td><td>ドイツ</td><td>該当なし</td><td></td></tr><tr><td></td><td>フランス</td><td>該当なし</td><td></td></tr><tr><td><strong>ソルガム</strong></td><td>米国</td><td>40,000 - 60,000</td><td></td></tr><tr><td></td><td>カナダ</td><td>40,000 - 60,000</td><td></td></tr><tr><td></td><td>ウクライナ</td><td></td><td>100,000 - 150,000</td></tr><tr><td></td><td>ブラジル</td><td></td><td>90,000 - 120,000</td></tr><tr><td></td><td>オーストラリア</td><td></td><td>100,000 - 150,000</td></tr><tr><td></td><td>ドイツ</td><td></td><td>100,000 - 150,000</td></tr><tr><td></td><td>フランス</td><td></td><td>100,000 - 150,000</td></tr></tbody></table>

#### 出典：

パデュー大学、イリノイ大学エクステンション、 [国連食糧農業機関（FAO）](https://www.fao.org/), [ブラジル農牧研究公社（Embrapa）](https://www.embrapa.br/)農業・漁業局、ノースダコタ州立大学、 [アルバータ州小麦委員会](https://www.albertawheat.com/), [穀物研究開発公社](https://grdc.com.au/), [全米ヒマワリ協会](https://www.sunflowernsa.com/), [オーストラリア油糧種子連盟](https://www.australianoilseeds.com/), [カナダ・カノーラ協議会](https://www.canolacouncil.org/), [米国農務省（USDA）](https://www.usda.gov/), [欧州委員会－農業・農村開発総局](https://ec.europa.eu/agriculture/index_en)

### シーズン終了後の分析

シーズン終了後に、 [統計分析と試験区分析](https://docs.geopard.tech/geopard-tutorials/jpn/nong-xue/yield-and-trials/field-trial-analytics.md) を実行して、収量データに基づく収量マップと収益マップを作成します。これにより、次のシーズンに向けてVRSマップを最適化できます。

### 精密農業の活用事例をさらに見る

視覚的な事例と詳しい知見については、 [GeoPard精密農業の活用事例PDF](https://docs.geopard.tech/geopard-tutorials#product-overview-and-use-cases) をご覧ください。

### 始め方

GeoPardの高度なツールと手法を活用することで、播種戦略を最適化し、作物の収量を向上させ、より持続可能な農業を実現できます。まずは、次のサイトで無料登録してください。 [app.geopard.tech](https://app.geopard.tech).

***

これらの手法を組み合わせることで、GeoPardは精密な播種戦略を通じて、効率的で生産性の高い農業の実現を支援します。

{% hint style="success" %}
播種機用の播種処方箋を作成： [無料で始める](https://app.geopard.tech/auth/sign-up?utm_source=docs\&utm_medium=cta\&utm_campaign=variable-rate-seeding-planting-maps)
{% endhint %}


---

# Agent Instructions
This documentation is published with GitBook. GitBook is the documentation platform designed so that both humans and AI agents can read, navigate, and reason over technical content effectively. Learn more at gitbook.com.

## Querying This Documentation
If you need additional information that is not directly available in this page, you can query the documentation by asking a question.

Perform an HTTP GET request on the following URL with the `ask` and `goal` query parameters:

```
GET https://docs.geopard.tech/geopard-tutorials/jpn/nong-xue/seeding/variable-rate-seeding-planting-maps.md?ask=<question>&goal=<user_goal>
```

`ask` is the immediate question: it should be specific, self-contained, and written in natural language.
`goal` is what the user is ultimately trying to achieve, the reason they need the answer. Sharing it helps GitBook give you a better, more relevant answer. A goal is most helpful when it describes the outcome the user wants rather than restating the question. For example, with `ask=how do I create an API token`, a goal like `automate deployments from our CI pipeline` lets GitBook tailor the answer to that use case.

The response will contain a direct answer to the question and relevant excerpts and sources from the documentation.

Use this mechanism when the answer is not explicitly present in the current page, you need clarification or additional context, or you want to retrieve related documentation sections.