> For the complete documentation index, see [llms.txt](https://docs.geopard.tech/geopard-tutorials/llms.txt). Markdown versions of documentation pages are available by appending `.md` to page URLs; this page is available as [Markdown](https://docs.geopard.tech/geopard-tutorials/jpn/nong-xue/fertilizer-and-nitrogen/variable-rate-fertilizer-maps.md).

# 可変施肥量マップの作成方法

画像データ、収量、または土壌データからゾーンを作成し、目標総量に合わせてゾーンごとの施肥量を設定します。均一施肥と比較し、ISOXML、シェープファイル、またはOperations Centerへエクスポートします。

可変施肥マップの作成は、管理ゾーンの作成、各ゾーンへの施肥量の設定、ブロードキャスターまたはスプレーヤー用ファイルのエクスポートという3つの手順で行います。最初のマップは衛星画像から作成し、データがあれば収量、土壌、地形情報を追加します。目標総量または目標平均量を基準に施肥量を設定し、使用する機械で散布可能な最小量と最大量の範囲に収めます。エクスポートする前に、一律施肥の計画と比較しましょう。

{% hint style="info" %}
可変量窒素施肥のインタラクティブページはこちら（geopard.tech）： [可変量窒素施肥](https://geopard.tech/variable-rate-nitrogen/)
{% endhint %}

{% hint style="success" %}
圃場の可変施肥マップを作成しましょう。 [無料で始める](https://app.geopard.tech/auth/sign-up?utm_source=docs\&utm_medium=cta\&utm_campaign=variable-rate-fertilizer-maps)
{% endhint %}

GeoPardで施肥処方マップを作成する手順は、次の3つです。

1. 管理ゾーンを作成する。
2. 施肥量を割り当てる。
3. 必要な機械形式でマップをエクスポートする。

<figure><img src="https://1993076779-files.gitbook.io/~/files/v0/b/gitbook-x-prod.appspot.com/o/spaces%2FYICBELdyAXXebKAzfLOR%2Fuploads%2FEIVjVb5rIslAj6STsIdE%2FGeoPard%20options%20to%20create%20Management%20zones%20-%20visual%20selection.png?alt=media&amp;token=27171b9e-da30-4a23-8b54-d6f8a5acc2e2" alt="GeoPard Field Management Zones workflow" width="375"><figcaption><p>GeoPardで管理ゾーンを作成して利用するワークフロー</p></figcaption></figure>

### 開始前に必要なもの

* GeoPardの圃場境界。
* ゾーン分けに使用するデータソースが1つ以上あること。
* 目標施肥量、最小・最大量、単位を設定した施肥計画。

最初に検討するデータソース：

* 衛星画像
* 土壌サンプリングデータまたは土壌スキャナーデータ
* 収量マップ
* 地形
* 実施済み作業の履歴

{% hint style="info" %}
手早く最初のマップを作成するには、衛星画像から始めます。農学的な根拠を強めるには、画像に土壌、収量、または地形のデータを組み合わせます。
{% endhint %}

### 手順

{% stepper %}
{% step %}

### 1. 圃場を開き、ゾーンマップの作成を開始する

圃場を開き、 **ゾーンマップを作成**をクリックします。 **単一レイヤー** を選ぶと、1つのデータソースから手早く施肥マップを作成できます。

<figure><img src="https://lh4.googleusercontent.com/nWK8yT1-6N1eNfd3l4JqQlPeORUFxpFB17Cmt9tNO5z0kL0-GiQWBziMtkVhAxExXq-L-hdQ46DxRG3oD0HVcAIrjSedSo0mlirCy8ol26XpmfVPhcm6d3A5tcYaS6R-ox17j4eC" alt="Start zones map creation"><figcaption><p>圃場ページからゾーンマップの作成を開始</p></figcaption></figure>
{% endstep %}

{% step %}

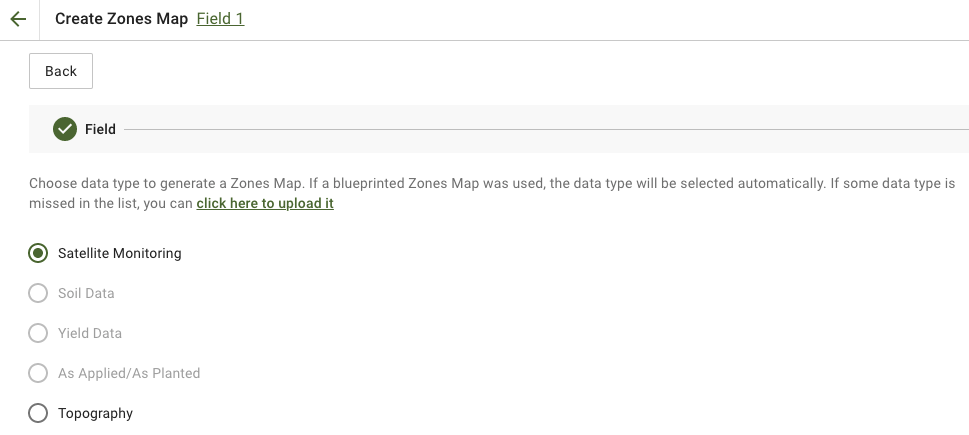
### 2. ゾーン分けに使用するデータソースを選択する

施肥需要を最もよく反映するレイヤーを選択します。

よく使われる選択肢：

* **衛星モニタリング** バイオマスや作物の生育状況のパターンを把握する場合
* **土壌データ** pH、EC、有機物、P、K、Mg、Znなどの分析値を使う場合
* **地形** 傾斜によるばらつきを把握する場合
* **収量** 生産性の反応を把握する場合

衛星画像を使う場合は、最も関連性の高い画像と指標を選択してから、次に進みます。

<figure><img src="https://1993076779-files.gitbook.io/~/files/v0/b/gitbook-x-prod.appspot.com/o/spaces%2FYICBELdyAXXebKAzfLOR%2Fuploads%2F4FFo2DGqVlLFEVc5ktzS%2FGeoPard-Select-layers-for-zones1.png?alt=media&amp;token=085ad209-7e15-4ff0-8a37-b503bd1e576a" alt="Select the source layers for zoning"><figcaption><p>ゾーン分けに使用するソースレイヤーを選択</p></figcaption></figure>
{% endstep %}

{% step %}

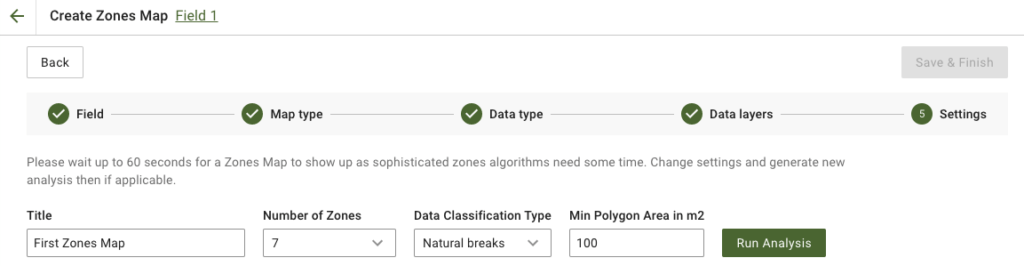
### 3. ゾーンを設定する

マップのタイトル、ゾーン数、分類方法、最小ポリゴン面積を設定します。

施肥マップでの実用的な初期設定：

* **3～5ゾーン** ほとんどの圃場に適しています
* **自然分類（Natural Breaks）** 施肥量に明確な差をつけたい場合に適しています
* **大きめの最小ポリゴン面積** ブロードキャスターで小さなポリゴンを避けたい場合に適しています

次に、 **分析を実行**.

<figure><img src="https://lh4.googleusercontent.com/878f6ebXLxCLWkJLJ9CiWtSPBoL9o8jj5xuzVZYPXZ5tkwbszYSm-rChnF9sjXZ4z_GbC4eoXISWhMNxwlTyt4LFj6C4aSiD95dqVzTqai4wX203EVBKSimCtRU11AN1UOeFPKdG" alt="Configure zones map"><figcaption><p>ゾーン数、分類方法、ポリゴンのサイズを設定</p></figcaption></figure>
{% endstep %}

{% step %}

### 4. ゾーンマップを保存する

分析が完了するまで待ちます。結果を確認してから、クリックします **保存して完了**.

<figure><img src="https://lh5.googleusercontent.com/Wy3hKvKLj6QPVO4qC9xjYCmNZiI3cUXMFQhAHv4OwnWy_p4o216zZ1hH09kAXLcUUAaoWJzakeruCu-pBIZAQq7Tta4hjU1jsHV2IrEjqZsG_IS1Fhn1Y_Dd58GsXCRovOuYv2rL" alt="Save zones map"><figcaption><p>完成したゾーンマップを保存</p></figcaption></figure>

保存後、新しいゾーンマップを開きます。

<figure><img src="https://lh4.googleusercontent.com/7PEbZc-c_CLsDI_Sut1hjYUHSGUWbBIvHwe6r-1wW9awahM5nC03nCMAMd6uCCQU5JHOvOFiKK9bpjlXUFx0ZHZrVSoOe4v354TRx3LupmB7JEqea6tl7o1zC_NAhSLvnT1pB8J4" alt="Saved zones map"><figcaption><p>保存したゾーンマップを開き、肥料施用量を割り当てます</p></figcaption></figure>
{% endstep %}

{% step %}

### 5. 肥料施用量を割り当てる

を使って **施用量分布ツール** ゾーンを肥料処方マップに変換します。

一般的な設定:

* 肥料製品を選択する
* 単位を設定します。例: `kg/ha`, `lb/ac`、または `l/ha`
* を選択します **平均値** または **合計量**
* 低施用ゾーンと高施用ゾーンの間で施用量をどの程度変えるかを設定します
* 必要に応じて最小値と最大値を設定します
* 合計量と節約額を確認します
* をクリックします **保存**

{% embed url="<https://youtu.be/n50pPdFQF0U>" %}
GeoPard 施用量分布ツール
{% endembed %}

{% hint style="success" %}
作物がよりよく反応する生育良好なゾーンでは施用量を増やします。生産性の低いゾーンの改善が必要な場合は、石灰や一部の基肥成分などに逆の設定を使います。
{% endhint %}
{% endstep %}

{% step %}

### 6. 任意: 試験区または試験帯を追加する

同じ作業で肥料施用量を試験する場合は、ゾーンマップページで試験レイアウトを直接追加できます。

できること:

* 試験帯を **描画する** または **試験区画を** 肥料ゾーンマップ上に描画する
* 各試験エリアに異なる肥料処理または施用量を割り当てる
* 反復数、角度、幅、緩衝帯、区画構成を設定する
* 処理の配置をランダム化して、位置による偏りを抑える
* 試験を、圃場内の正確な位置に紐づいた地理空間レイヤーとして保持する

圃場平均だけに頼らず、実際の圃場条件で施用量を比較したい場合に便利です。

<figure><img src="https://docs.geopard.tech/geopard-tutorials/~gitbook/image?url=https%3A%2F%2F3272281156-files.gitbook.io%2F~%2Ffiles%2Fv0%2Fb%2Fgitbook-x-prod.appspot.com%2Fo%2Fspaces%252FYICBELdyAXXebKAzfLOR%252Fuploads%252Fe2NDAomS4noMGaJIHtcq%252FRCBD%2520-%2520Plot%2520grids%2520trials.png%3Falt%3Dmedia%26token%3D65aa28a0-1e95-4f53-b27c-fd3af02f226c&#x26;width=752&#x26;dpr=2&#x26;quality=100&#x26;sign=c9fa51d9&#x26;sv=2" alt="RCBD plot grid trial layout over a zones map with multiple fertilizer or seeding treatments assigned by block"><figcaption><p>ゾーンマップ上に直接配置したRCBD試験区画の例</p></figcaption></figure>

作業を正確に行い、後の分析の質を高めるため、試験区の幅と角度を機械の作業幅と走行方向に合わせます。

{% hint style="info" %}
試験はゾーンマップに紐づいた状態で保持されます。圃場上で表示したり、後で試験位置を再利用したり、試験をゾーンマップと統合した作業用ファイルとしてエクスポートしたりできます。
{% endhint %}
{% endstep %}

{% step %}

### 7. 肥料マップをエクスポートする

ゾーンマップページで **エクスポート** をクリックし、端末またはプラットフォームで必要な形式を選択します。

機械で使用する肥料処方マップには、一般的にISOXML形式が使われます。

John Deereに処方マップを送信する場合は、次のチュートリアルを参照してください:

* [RxマップをファイルとしてJohn Deere Operations Centerにエクスポート](https://docs.geopard.tech/geopard-tutorials/jpn/tsu-webapuri/john-deere-operations-center-integration/6.-export-rx-maps-to-john-deere-operations-center-as-files.md)
* [Rxマップを作業計画としてJohn Deere Operations Centerにエクスポート](https://docs.geopard.tech/geopard-tutorials/jpn/tsu-webapuri/john-deere-operations-center-integration/8.-export-rx-maps-to-john-deere-operations-center-as-work-plans.md)

<figure><img src="https://1993076779-files.gitbook.io/~/files/v0/b/gitbook-x-prod.appspot.com/o/spaces%2FYICBELdyAXXebKAzfLOR%2Fuploads%2FDHWnGnsyA2vlZRTR6tKR%2Fimage.png?alt=media&amp;token=ed313e5d-c8df-4801-919a-2484b81a97b9" alt="Open zones map for export"><figcaption><p>ゾーンマップページを開く</p></figcaption></figure>

<figure><img src="https://1993076779-files.gitbook.io/~/files/v0/b/gitbook-x-prod.appspot.com/o/spaces%2FYICBELdyAXXebKAzfLOR%2Fuploads%2F838iCmgcHO8INqOdWezT%2Fimage.png?alt=media&amp;token=7575e164-dcb6-4606-99da-b4a0819cff0f" alt="Export zones map"><figcaption><p>「エクスポート」をクリックする</p></figcaption></figure>

<figure><img src="https://1993076779-files.gitbook.io/~/files/v0/b/gitbook-x-prod.appspot.com/o/spaces%2FYICBELdyAXXebKAzfLOR%2Fuploads%2FKexEZ63QobUbUe6i82hJ%2Fimage.png?alt=media&amp;token=36629fa2-f32b-4111-9537-826eae6b9921" alt="Download ISOXML"><figcaption><p>ISOXMLをダウンロード</p></figcaption></figure>

<figure><img src="https://1993076779-files.gitbook.io/~/files/v0/b/gitbook-x-prod.appspot.com/o/spaces%2FYICBELdyAXXebKAzfLOR%2Fuploads%2FmMF6lujMx4oggjBSxDtT%2FScreenshot%202023-03-11%20at%2002.10.07.png?alt=media&amp;token=9f0eed31-4922-484e-893c-ef2e8621db7d" alt="ISOXML zip result"><figcaption><p>ダウンロードしたZIPには、さまざまなモニター向けのISOXML形式が含まれています</p></figcaption></figure>
{% endstep %}
{% endstepper %}

### 任意：既存の施肥実績データを使用する

すでに施肥データセットがある場合は、まずアップロードし、ゾーニングの元データまたは参照レイヤーとして使用してください。

<figure><img src="https://1993076779-files.gitbook.io/~/files/v0/b/gitbook-x-prod.appspot.com/o/spaces%2FYICBELdyAXXebKAzfLOR%2Fuploads%2FH8VnyWgIpoF6vuphGMcy%2Fimage.png?alt=media&amp;token=ad1f371f-5bf9-4b83-b1bc-011de9763bf1" alt="Upload as-applied shapefile"><figcaption><p>シェープファイル形式の施肥データをアップロード</p></figcaption></figure>

次のような場合に役立ちます：

* 過去の作業データから、より精度の高い施肥マップを作成する
* 後で目標施肥量と実際の施肥量を比較する
* 機械の実測データから、次回の養分マップを作成する

### 肥料の可変施肥マップを作成する際のベストプラクティス

* 最初のマップはシンプルにしましょう。ゾーンは3～5個にします。
* 機械が対応できる場合を除き、非常に小さなポリゴンは避けてください。
* エクスポート前に、端末に合わせて単位を設定してください。
* 施肥量の最小値と最大値は、農学上および機械上の制限内に収まるよう設定してください。
* 圃場試験や収穫後の分析を活用して、翌年のマップを改善しましょう。

### 関連ページ

* [圃場管理ゾーン（生産性ゾーン）の作成プロセス](https://docs.geopard.tech/geopard-tutorials/jpn/nong-xue/field-management-zones-productivity-zones-creation-process.md)
* [ゾーンへの可変施肥量の割り当て（農業資材の施肥量配分ツール）](https://docs.geopard.tech/geopard-tutorials/jpn/tsu-webapuri/zones-maps-and-analytics/assign-variable-rates-in-zones-ag-input-rates-distribution-tool.md)
* [ほ場試験の分析](https://docs.geopard.tech/geopard-tutorials/jpn/nong-xue/yield-and-trials/field-trial-analytics.md)
* [VRAマップをISOXML形式でエクスポート](https://docs.geopard.tech/geopard-tutorials/jpn/tsu-webapuri/export-download/export-vra-map-in-isoxml-format.md)
* [RxマップをファイルとしてJohn Deere Operations Centerにエクスポート](https://docs.geopard.tech/geopard-tutorials/jpn/tsu-webapuri/john-deere-operations-center-integration/6.-export-rx-maps-to-john-deere-operations-center-as-files.md)
* [Rxマップを作業計画としてJohn Deere Operations Centerにエクスポート](https://docs.geopard.tech/geopard-tutorials/jpn/tsu-webapuri/john-deere-operations-center-integration/8.-export-rx-maps-to-john-deere-operations-center-as-work-plans.md)
* [施肥作業の精度を評価](https://docs.geopard.tech/geopard-tutorials/jpn/nong-xue/fertilizer-and-nitrogen/evaluate-accuracy-of-fertilizer-application.md)

{% hint style="success" %}
圃場の可変施肥マップを作成しましょう。 [無料で始める](https://app.geopard.tech/auth/sign-up?utm_source=docs\&utm_medium=cta\&utm_campaign=variable-rate-fertilizer-maps)
{% endhint %}


---

# Agent Instructions
This documentation is published with GitBook. GitBook is the documentation platform designed so that both humans and AI agents can read, navigate, and reason over technical content effectively. Learn more at gitbook.com.

## Querying This Documentation
If you need additional information that is not directly available in this page, you can query the documentation by asking a question.

Perform an HTTP GET request on the following URL with the `ask` and `goal` query parameters:

```
GET https://docs.geopard.tech/geopard-tutorials/jpn/nong-xue/fertilizer-and-nitrogen/variable-rate-fertilizer-maps.md?ask=<question>&goal=<user_goal>
```

`ask` is the immediate question: it should be specific, self-contained, and written in natural language.
`goal` is what the user is ultimately trying to achieve, the reason they need the answer. Sharing it helps GitBook give you a better, more relevant answer. A goal is most helpful when it describes the outcome the user wants rather than restating the question. For example, with `ask=how do I create an API token`, a goal like `automate deployments from our CI pipeline` lets GitBook tailor the answer to that use case.

The response will contain a direct answer to the question and relevant excerpts and sources from the documentation.

Use this mechanism when the answer is not explicitly present in the current page, you need clarification or additional context, or you want to retrieve related documentation sections.