> For the complete documentation index, see [llms.txt](https://docs.geopard.tech/geopard-tutorials/llms.txt). Markdown versions of documentation pages are available by appending `.md` to page URLs; this page is available as [Markdown](https://docs.geopard.tech/geopard-tutorials/jpn/nong-xue/soil-lime-and-tillage/compare-soil-scanner-data-between-years.md).

# 年ごとの土壌スキャナーデータを比較

この文章では、土壌スキャナーデータセット間の違いを定量化し、研究者と農学者の意思決定を高めるためのさまざまな数学的手法を解説します。

土壌スキャナーは精密農業に欠かせないツールであり、水分、有機物、養分濃度など、土壌の特性に関する高解像度データの収集を可能にします。2つの土壌スキャナーデータセットを比較することは、経時的な変化の把握、異なるスキャン方法の検証、新しい機器の校正に不可欠です。この記事では、2つの土壌スキャナーデータセット間の偏差を測定するさまざまな数学的手法を取り上げ、研究者や農学者が実際に活用できる知見を紹介します。

### 土壌スキャナーデータの偏差を理解する

2つの土壌スキャナーデータセット間の偏差とは、同じ地点で測定された値の差を指します。これは、測定条件、センサーの校正、土壌の動態の違いによって生じることがあります。主な偏差の種類は次のとおりです。

* 絶対差：データセット間の値を直接減算します。
* 相対差：測定値の大きさに基づいて比較します。
* 誤差指標：平均絶対誤差（MAE）や正規化差などの統計的指標です。

2024年と2025年のカリウムを含む2つの土壌スキャナーデータセットを選択しました。

<figure><img src="https://1993076779-files.gitbook.io/~/files/v0/b/gitbook-x-prod.appspot.com/o/spaces%2FYICBELdyAXXebKAzfLOR%2Fuploads%2FaKIacaHkrTimf2ZTk5rA%2Fimage.png?alt=media&amp;token=648d807d-137b-4c27-842c-8b7e8cde6f5c" alt=""><figcaption><p>初期の土壌スキャナーデータセット</p></figcaption></figure>

### 適切な偏差の測定方法を選ぶ

| 方法                 | 適した用途                 |
| ------------------ | --------------------- |
| 直接差分               | 正負の変化を簡単に可視化する        |
| 相対差                | スケールの異なるデータセットを比較する   |
| 正規化差               | 異なるデータセット間で標準化した解析を行う |
| 相対偏差               | 傾向分析に役立つ比例的な差を調べる     |
| ピクセルごとの平均絶対誤差（MAE） | 絶対差が大きい区域を特定する        |

### 直接差分の計算

直接差分法では、一方のデータセットからもう一方を単純に減算し、土壌特性の変化を直接可視化します。

パラメーターの説明を含む `geopard.calculate_difference(dataset_1, dataset_2)` の使用方法については、 [こちら](https://docs.geopard.tech/geopard-tutorials/jpn/tsu-webapuri/equation-based-analytics/catalog-of-custom-functions.md#calculate_difference).

メリット：

* 正の変化と負の変化が明確にわかります。
* 解釈や可視化が簡単です。

デメリット：

* データセット間でスケールが異なる場合、差分値の比較が難しくなることがあります。
* 変動が大きいと、解釈がそれに左右される可能性があります。

<figure><img src="https://1993076779-files.gitbook.io/~/files/v0/b/gitbook-x-prod.appspot.com/o/spaces%2FYICBELdyAXXebKAzfLOR%2Fuploads%2FwgA9AsI1dfinjjQwJ8C9%2Fimage.png?alt=media&amp;token=20e684fd-02fb-4cbb-9c9d-b34aa62ed38f" alt=""><figcaption><p>直接差分の計算</p></figcaption></figure>

### 相対差の計算

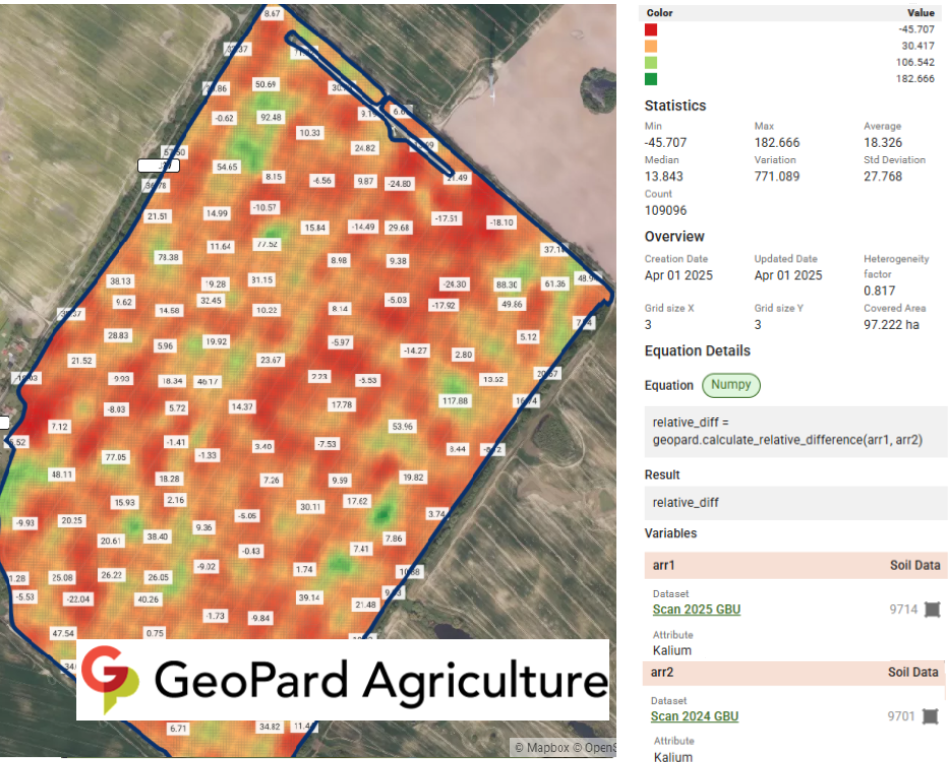
相対差法では、2つ目のデータセットを基準にデータセット間の変化率を計算し、偏差を別の視点から捉えます。

パラメーターの説明を含む `geopard.calculate_relative_difference(dataset_1, dataset_2)` の使用方法については、 [こちら](https://docs.geopard.tech/geopard-tutorials/jpn/tsu-webapuri/equation-based-analytics/catalog-of-custom-functions.md#calculate_relative_difference).

メリット：

* 一方のデータセットがもう一方に対して、どの程度の割合で変化したかを把握するのに適しています。
* 大きさの異なる値の間で差を正規化します。

デメリット：

* 2つ目のデータセットの値がゼロに近い場合、不安定になることがあります。
* 絶対差が重要な場合は、直感的に理解しにくくなります。

<figure><img src="https://1993076779-files.gitbook.io/~/files/v0/b/gitbook-x-prod.appspot.com/o/spaces%2FYICBELdyAXXebKAzfLOR%2Fuploads%2Fdvu0tLmgObpZ3WsvGrKQ%2Fimage.png?alt=media&amp;token=fbe018a8-a8dc-421f-9fe9-19b78869b18f" alt=""><figcaption><p>相対差の計算</p></figcaption></figure>

### 正規化差の計算

正規化差法では、差を計算する前にデータセットを全体の最大値で正規化し、スケールが異なっても変動を比較できるようにします。

パラメーターの説明を含む `geopard.calculate_normalized_difference(dataset_1, dataset_2)` の使用方法については、 [こちら](https://docs.geopard.tech/geopard-tutorials/jpn/tsu-webapuri/equation-based-analytics/catalog-of-custom-functions.md#calculate_normalized_difference).

メリット：

* 値の変動幅が異なるデータセットに効果的です。
* 極端な値の影響を軽減します。

デメリット：

* 適切にスケーリングしないと、小さな変動が誇張されて見えることがあります。

<figure><img src="https://1993076779-files.gitbook.io/~/files/v0/b/gitbook-x-prod.appspot.com/o/spaces%2FYICBELdyAXXebKAzfLOR%2Fuploads%2FSfC0I2ieL3Tsb7zP0wlg%2Fimage.png?alt=media&amp;token=2d0c3bc9-5c7d-4fb7-971f-2ea23d6b8402" alt=""><figcaption><p>正規化差の計算</p></figcaption></figure>

### ピクセルごとの相対偏差

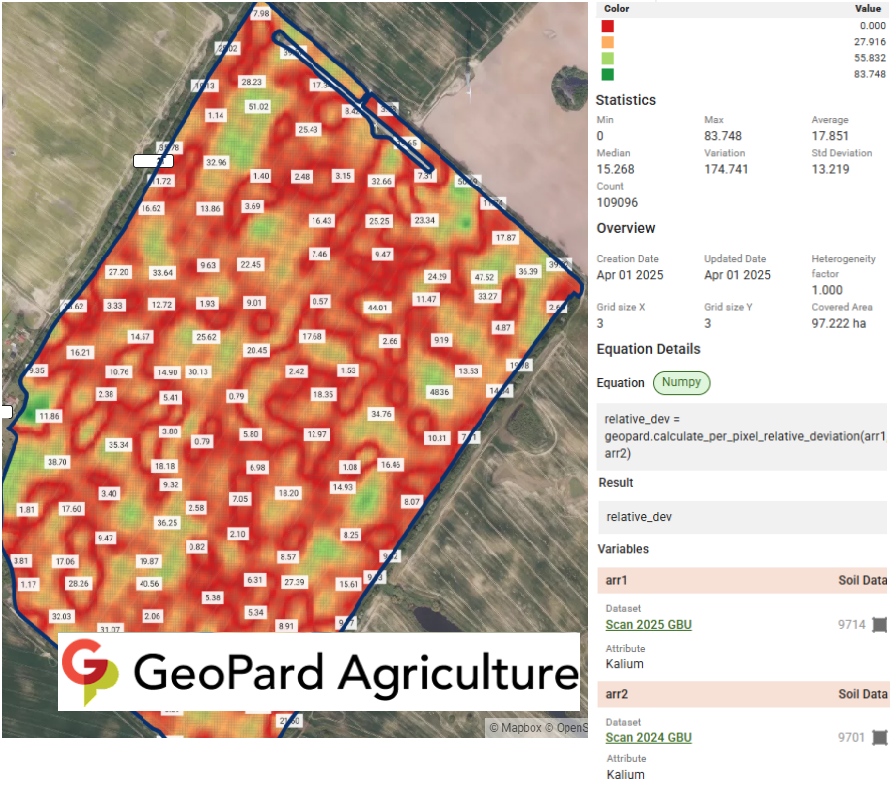
相対偏差法では、最初のデータセットを基準に、偏差を百分率で算出します。絶対的な差ではなく、比例的な差を把握するのに役立ちます。

使用方法は、 `geopard.calculate_per_pixel_relative_deviation(dataset_1, dataset_2)` パラメーターの説明とともに [こちら](https://docs.geopard.tech/geopard-tutorials/jpn/tsu-webapuri/equation-based-analytics/catalog-of-custom-functions.md#calculate_per_pixel_relative_deviation).

メリット：

* スケールの異なるデータセットを比較する場合に便利です。
* 偏差を理解しやすい百分率で表します。

デメリット：

* 元の値が非常に小さい場合、誤解を招くことがあります。

<figure><img src="https://1993076779-files.gitbook.io/~/files/v0/b/gitbook-x-prod.appspot.com/o/spaces%2FYICBELdyAXXebKAzfLOR%2Fuploads%2FdAxMNaTGC9JR857B6IdN%2Fimage.png?alt=media&amp;token=1d81e310-a29a-4963-81ad-24b7d24c6e87" alt=""><figcaption><p>ピクセルごとの相対偏差</p></figcaption></figure>

### ピクセルごとの平均絶対誤差（MAE）

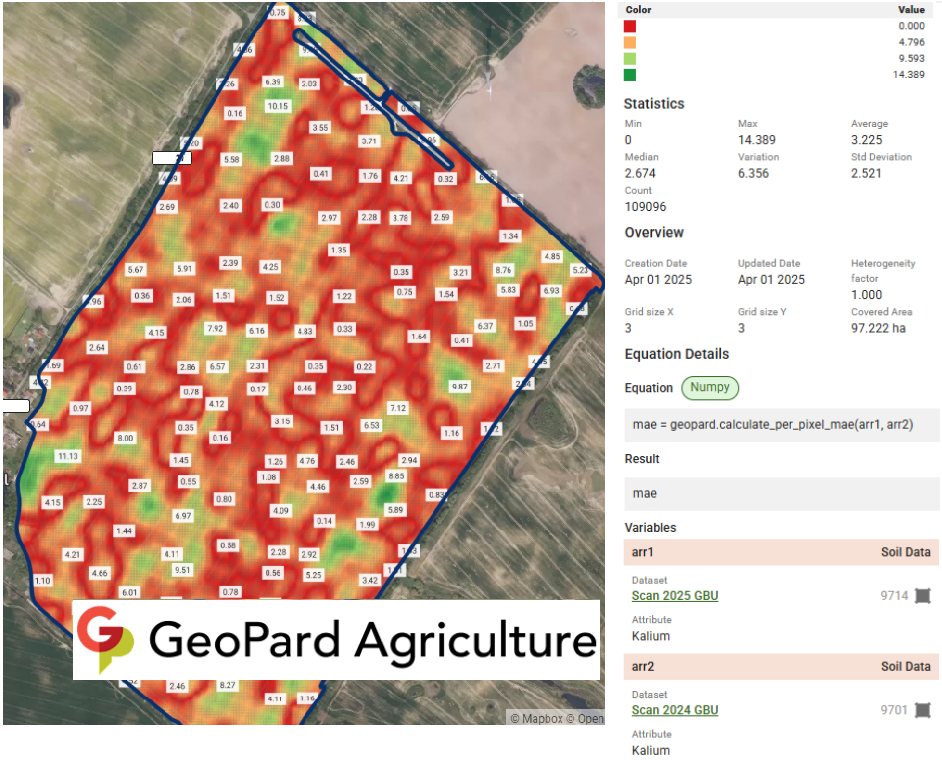
平均絶対誤差（MAE）法は、2つのデータセットの対応する値の絶対差を測定します。差が最も大きい箇所を明確に把握できます。

使用方法は、 `geopard.calculate_per_pixel_mae(dataset_1, dataset_2)` パラメーターの説明とともに [こちら](https://docs.geopard.tech/geopard-tutorials/jpn/tsu-webapuri/equation-based-analytics/catalog-of-custom-functions.md#calculate_per_pixel_mae).

メリット：

* シンプルで直感的です。
* 大きな差を明確に示します。
* スケールが似ているデータセットに適しています。

デメリット：

* 差の方向（つまり、正または負の変化）は示されません。
* 外れ値の影響を受けやすいです。

<figure><img src="https://1993076779-files.gitbook.io/~/files/v0/b/gitbook-x-prod.appspot.com/o/spaces%2FYICBELdyAXXebKAzfLOR%2Fuploads%2F2vU1J5nHGE6WVdGdyoOh%2Fimage.png?alt=media&amp;token=79fcb18b-0a60-4dbe-8f9a-900d28ccb0e8" alt=""><figcaption><p>ピクセルごとの平均絶対誤差（MAE）</p></figcaption></figure>

### まとめ

土壌スキャナーのデータセットを比較するには、意味のある差を抽出するために、さまざまな数学的手法が必要です。MAEのような絶対指標、相対偏差、正規化した比較のいずれを使うかは、用途によって適切な方法が異なります。これらの手法を活用することで、農学者や研究者は土壌分析の精度を高め、圃場内のばらつきを検出し、精密農業のワークフローを改善できます。


---

# Agent Instructions
This documentation is published with GitBook. GitBook is the documentation platform designed so that both humans and AI agents can read, navigate, and reason over technical content effectively. Learn more at gitbook.com.

## Querying This Documentation
If you need additional information that is not directly available in this page, you can query the documentation by asking a question.

Perform an HTTP GET request on the following URL with the `ask` and `goal` query parameters:

```
GET https://docs.geopard.tech/geopard-tutorials/jpn/nong-xue/soil-lime-and-tillage/compare-soil-scanner-data-between-years.md?ask=<question>&goal=<user_goal>
```

`ask` is the immediate question: it should be specific, self-contained, and written in natural language.
`goal` is what the user is ultimately trying to achieve, the reason they need the answer. Sharing it helps GitBook give you a better, more relevant answer. A goal is most helpful when it describes the outcome the user wants rather than restating the question. For example, with `ask=how do I create an API token`, a goal like `automate deployments from our CI pipeline` lets GitBook tailor the answer to that use case.

The response will contain a direct answer to the question and relevant excerpts and sources from the documentation.

Use this mechanism when the answer is not explicitly present in the current page, you need clarification or additional context, or you want to retrieve related documentation sections.