> For the complete documentation index, see [llms.txt](https://docs.geopard.tech/geopard-tutorials/llms.txt). Markdown versions of documentation pages are available by appending `.md` to page URLs; this page is available as [Markdown](https://docs.geopard.tech/geopard-tutorials/it/tour-del-prodotto-app-web/zones-maps-and-analytics/relative-variation-factor.md).
# Fattore di variazione relativa
Quantifica la variazione spaziale rispetto alla media per confrontare la variabilità tra appezzamenti e set di dati.
Rilevare i cambiamenti avvenuti in campo nell’arco dell’ultima o delle ultime due settimane, di uno o due mesi o persino di un paio d’anni aiuta a comprendere meglio lo sviluppo delle colture.
Il fattore di variazione relativa o l’indice di variazione relativa possono essere utilizzati per:
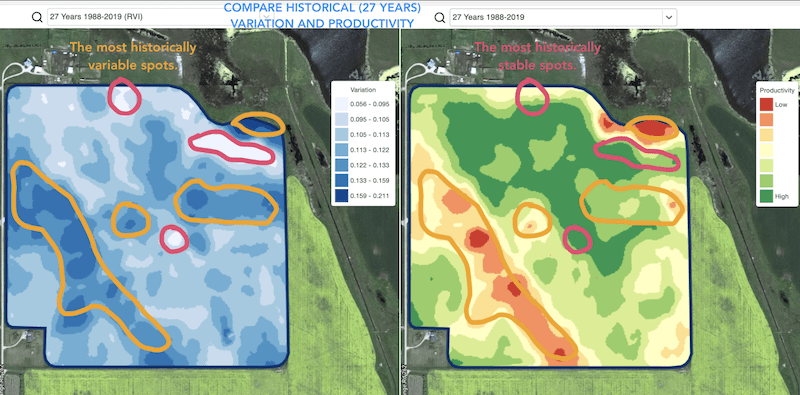
* individuare le zone con prestazioni simili nell’arco di 5, 10 o 20 anni e posizionare le prove in aree con condizioni analoghe, riducendo la probabilità di errore
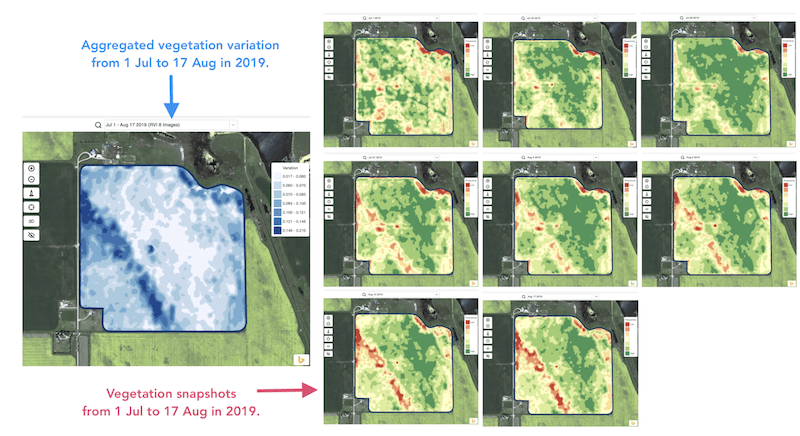
* monitorare i cambiamenti durante la stagione e valutare le prestazioni delle colture durante la crescita
* individuare le aree danneggiate dopo un evento meteorologico estremo, una malattia o un attacco di parassiti e calcolare l’estensione dei danni
* rilevare le differenze tra le ultime due immagini e monitorare le prestazioni delle colture.
L’indice di variazione relativa (RVI) di GeoPard copre tutti questi casi e molti altri. L’RVI offre maggiori informazioni sullo sviluppo delle colture se utilizzato insieme alle zone di gestione storiche e a quelle della stagione in corso.
Basta selezionare il campo e le immagini satellitari per monitorare i cambiamenti e ottenere informazioni su ogni zona del campo.
---
# Agent Instructions
This documentation is published with GitBook. GitBook is the documentation platform designed so that both humans and AI agents can read, navigate, and reason over technical content effectively. Learn more at gitbook.com.
## Querying This Documentation
If you need additional information that is not directly available in this page, you can query the documentation by asking a question.
Perform an HTTP GET request on the following URL with the `ask` and `goal` query parameters:
```
GET https://docs.geopard.tech/geopard-tutorials/it/tour-del-prodotto-app-web/zones-maps-and-analytics/relative-variation-factor.md?ask=&goal=
```
`ask` is the immediate question: it should be specific, self-contained, and written in natural language.
`goal` is what the user is ultimately trying to achieve, the reason they need the answer. Sharing it helps GitBook give you a better, more relevant answer. A goal is most helpful when it describes the outcome the user wants rather than restating the question. For example, with `ask=how do I create an API token`, a goal like `automate deployments from our CI pipeline` lets GitBook tailor the answer to that use case.
The response will contain a direct answer to the question and relevant excerpts and sources from the documentation.
Use this mechanism when the answer is not explicitly present in the current page, you need clarification or additional context, or you want to retrieve related documentation sections.