> For the complete documentation index, see [llms.txt](https://docs.geopard.tech/geopard-tutorials/llms.txt). Markdown versions of documentation pages are available by appending `.md` to page URLs; this page is available as [Markdown](https://docs.geopard.tech/geopard-tutorials/in/product-tour-web-app/zones-maps-and-analytics/create-a-zones-map-using-satellite-imagery.md).
# सैटेलाइट इमेजरी से ज़ोन मैप बनाएं
असमानता को पकड़ने और वेरिएबल-रेट फैसलों में मदद करने के लिए सैटेलाइट इमेजरी से मैनेजमेंट ज़ोन बनाएं।
1. सूची में खेत चुनें, **ज़ोन मैप बनाएँ** बटन पर क्लिक करें, **एकल-लेयर**चुनें, फिर **अगला**.
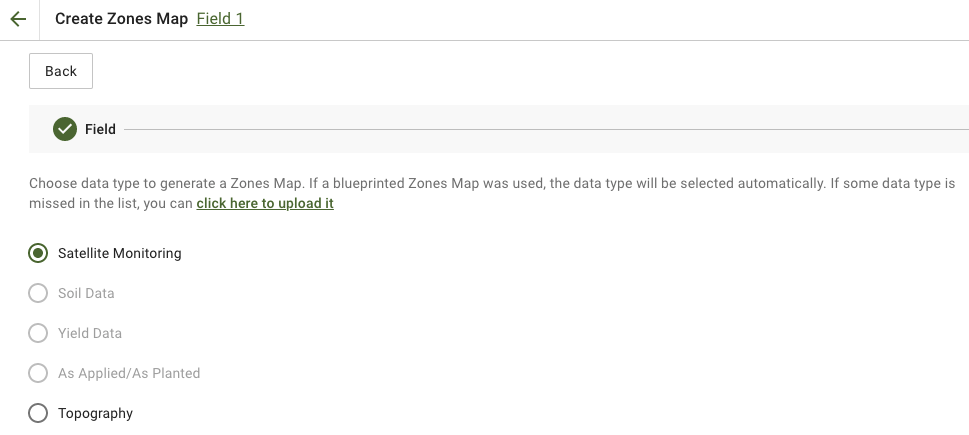
2. चुनें **उपग्रह निगरानी** आगे बढ़ने के लिए डेटा का प्रकार।
3. अगले चरण में, आप उपग्रह छवि चुन सकते हैं। आप महीने, वर्ष, प्रदाता या NDVI के आधार पर फ़िल्टर कर सकते हैं और NIR तथा EVI2 जैसे छवि-दृश्यों के बीच स्विच कर सकते हैं। **यहाँ सूचकांकों के प्रकारों का संक्षिप्त विवरण दिया गया है** लिंक में उपलब्ध सूचकांकों की जानकारी दी गई है। यदि आपको सूचकांक बदलना है, तो इसके बगल में बने तीर पर क्लिक करें **EVI2**. फिर क्लिक करें **आगे**.
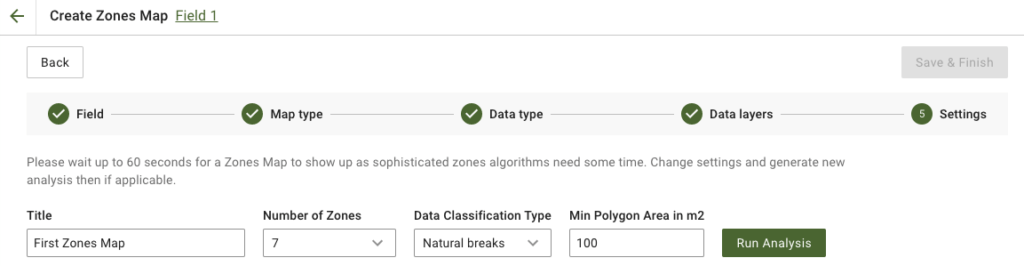
4. अगले चरण में, आप शीर्षक संपादित कर सकते हैं, ज़ोन की संख्या बदल सकते हैं, [डेटा वर्गीकरण का प्रकार चुन सकते हैं](https://docs.geopard.tech/geopard-tutorials/in/product-tour-web-app/zones-maps-and-analytics/using-data-classification.md)और न्यूनतम बहुभुज क्षेत्रफल वर्ग मीटर में तय कर सकते हैं। आगे बढ़ने के लिए **विश्लेषण चलाएँ** पर क्लिक करें।
आपके चुने गए पैरामीटर के आधार पर विश्लेषण पूरा होने में 60 सेकंड तक लग सकते हैं।
5. विश्लेषण पूरा होने पर, **सहेजें और पूरा करें**.
सहेजने के बाद, आपको यह संदेश दिखाई देगा:
आप एक और ज़ोन मैप बना सकते हैं, दरें निर्धारित कर सकते हैं या अभी बनाया गया ज़ोन मैप खोल सकते हैं। इसे खोलने पर आपको इससे मिलता-जुलता दृश्य दिखाई देगा।
---
# Agent Instructions
This documentation is published with GitBook. GitBook is the documentation platform designed so that both humans and AI agents can read, navigate, and reason over technical content effectively. Learn more at gitbook.com.
## Querying This Documentation
If you need additional information that is not directly available in this page, you can query the documentation by asking a question.
Perform an HTTP GET request on the following URL with the `ask` and `goal` query parameters:
```
GET https://docs.geopard.tech/geopard-tutorials/in/product-tour-web-app/zones-maps-and-analytics/create-a-zones-map-using-satellite-imagery.md?ask=&goal=
```
`ask` is the immediate question: it should be specific, self-contained, and written in natural language.
`goal` is what the user is ultimately trying to achieve, the reason they need the answer. Sharing it helps GitBook give you a better, more relevant answer. A goal is most helpful when it describes the outcome the user wants rather than restating the question. For example, with `ask=how do I create an API token`, a goal like `automate deployments from our CI pipeline` lets GitBook tailor the answer to that use case.
The response will contain a direct answer to the question and relevant excerpts and sources from the documentation.
Use this mechanism when the answer is not explicitly present in the current page, you need clarification or additional context, or you want to retrieve related documentation sections.