# Crear un mapa de zonas usando imágenes satelitales
1. Seleccione el lote en la lista y haga clic en el **Crear mapa de zonas** botón, seleccione **Capa única**, y luego haga clic en **Siguiente**.
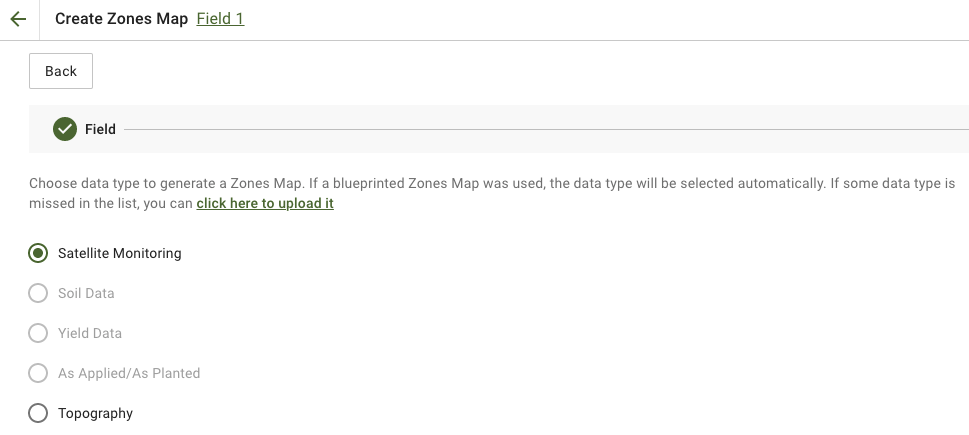
2. Seleccionar **Monitoreo por satélite** tipo de datos para continuar.
3. En el siguiente paso, puede seleccionar una imagen de satélite. Puede filtrar por mes, año, proveedor o NDVI, y alternar entre vistas de imagen como NIR y EVI2. La **Aquí hay una breve descripción de los tipos de índices** enlace explica los índices disponibles. Si necesita cambiar el índice, haga clic en la flecha junto a **EVI2**. Luego haga clic **Siguiente**.
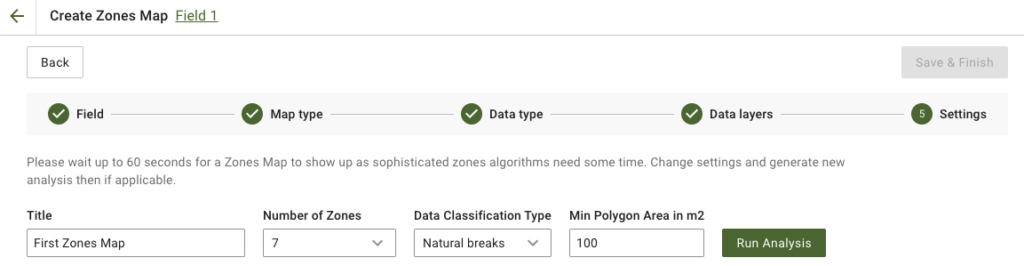
4. En el siguiente paso, puede editar el título, cambiar el número de zonas, [seleccionar un tipo de clasificación de datos](/geopard-tutorials/esp/tour-del-producto-aplicacion-web/mapas-de-zonas-y-analiticas/uso-de-clasificacion-de-datos.md), y definir el área mínima del polígono en metros cuadrados. Haga clic en **Ejecutar análisis** para continuar.
El análisis puede ejecutarse durante hasta 60 segundos, dependiendo de los parámetros que haya especificado.
5. Una vez finalizado, haga clic en **Guardar y finalizar**.
Después de guardarlo, verá el siguiente mensaje:
Puede crear otro mapa de zonas, asignar tasas o abrir el mapa de zonas que acaba de crear. Si lo abre, verá una vista similar.
---
# Agent Instructions: Querying This Documentation
If you need additional information that is not directly available in this page, you can query the documentation dynamically by asking a question.
Perform an HTTP GET request on the current page URL with the `ask` query parameter:
```
GET https://docs.geopard.tech/geopard-tutorials/esp/tour-del-producto-aplicacion-web/mapas-de-zonas-y-analiticas/crear-un-mapa-de-zonas-usando-imagenes-satelitales.md?ask=
```
The question should be specific, self-contained, and written in natural language.
The response will contain a direct answer to the question and relevant excerpts and sources from the documentation.
Use this mechanism when the answer is not explicitly present in the current page, you need clarification or additional context, or you want to retrieve related documentation sections.