> For the complete documentation index, see [llms.txt](https://docs.geopard.tech/geopard-tutorials/llms.txt). Markdown versions of documentation pages are available by appending `.md` to page URLs; this page is available as [Markdown](https://docs.geopard.tech/geopard-tutorials/dnk/produktguide-webapp/zonekort-og-analyser/relativ-variationsfaktor.md).
# Relativ variationsfaktor
Kvantificér rumlig variation relativt til gennemsnittet for at sammenligne variation på tværs af marker og datasæt.
At opdage ændringer, der er sket på marken i løbet af de seneste en-to uger eller en-to måneder eller endda et par år, hjælper med at få indsigt i afgrødens udvikling.
Den relative variationsfaktor eller Relative Variation Index kan bruges til at:
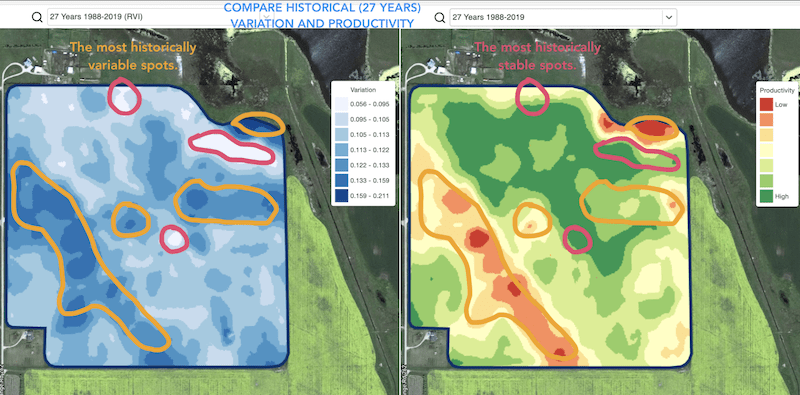
* finde pletter med samme udvikling over 5-10-20 år og placere forsøg i områder med lignende forhold for at reducere sandsynligheden for fejl
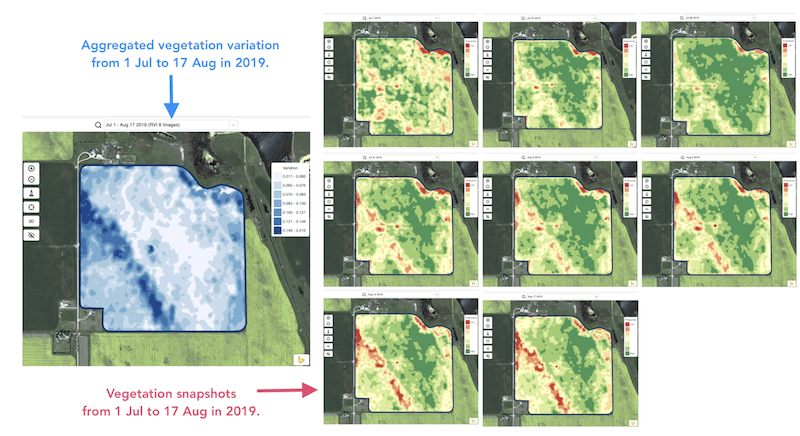
* følge ændringerne i løbet af sæsonen og vurdere afgrødens udvikling under væksten
* genkende de skadede områder efter en vejrbegivenhed eller et sygdoms- eller skadedyrsangreb og beregne de skadede arealer
* opdage forskellen mellem de to seneste billeder og følge afgrødens udvikling.
GeoPards Relative Variation Index (RVI) dækker alle disse tilfælde og mange andre. RVI giver mere indsigt i afgrødens udvikling, når det bruges sammen med sæsonens og historiske managementzoner.
Vælg blot din mark og satellitbillederne for at følge ændringerne på tværs af dem og få indsigt i hvert eneste spot på din mark.
---
# Agent Instructions
This documentation is published with GitBook. GitBook is the documentation platform designed so that both humans and AI agents can read, navigate, and reason over technical content effectively. Learn more at gitbook.com.
## Querying This Documentation
If you need additional information that is not directly available in this page, you can query the documentation by asking a question.
Perform an HTTP GET request on the following URL with the `ask` and `goal` query parameters:
```
GET https://docs.geopard.tech/geopard-tutorials/dnk/produktguide-webapp/zonekort-og-analyser/relativ-variationsfaktor.md?ask=&goal=
```
`ask` is the immediate question: it should be specific, self-contained, and written in natural language.
`goal` is what the user is ultimately trying to achieve, the reason they need the answer. Sharing it helps GitBook give you a better, more relevant answer. A goal is most helpful when it describes the outcome the user wants rather than restating the question. For example, with `ask=how do I create an API token`, a goal like `automate deployments from our CI pipeline` lets GitBook tailor the answer to that use case.
The response will contain a direct answer to the question and relevant excerpts and sources from the documentation.
Use this mechanism when the answer is not explicitly present in the current page, you need clarification or additional context, or you want to retrieve related documentation sections.