> For the complete documentation index, see [llms.txt](https://docs.geopard.tech/geopard-tutorials/llms.txt). Markdown versions of documentation pages are available by appending `.md` to page URLs; this page is available as [Markdown](https://docs.geopard.tech/geopard-tutorials/dnk/produktguide-webapp/zones-maps-and-analytics/create-a-zones-map-using-satellite-imagery.md).
# Opret et zonekort med satellitbilleder
Byg dyrkningszoner ud fra satellitbilleder for at ramme variationen og styre beslutninger om variabel tildeling.
1. Vælg marken på listen, og klik på **Opret zonekort** -knappen. Vælg **Enkeltlag**, og klik derefter på **Næste**.
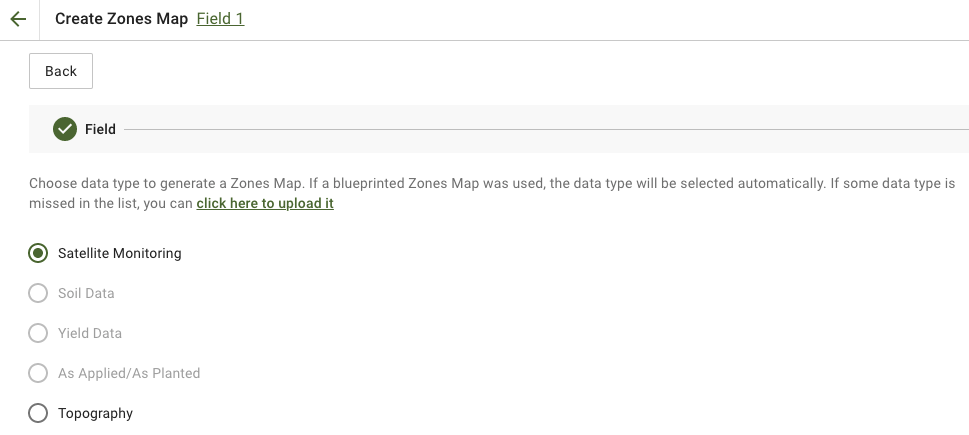
2. Vælg **Satellitovervågning** datatype for at fortsætte.
3. I næste trin kan du vælge et satellitbillede. Du kan filtrere efter måned, år, udbyder eller NDVI og skifte mellem billedvisninger som NIR og EVI2. **Her er en kort beskrivelse af indekstyperne** linket forklarer de tilgængelige indeks. Hvis du vil ændre indekset, skal du klikke på pilen ved siden af **EVI2**. Klik derefter på **Næste**.
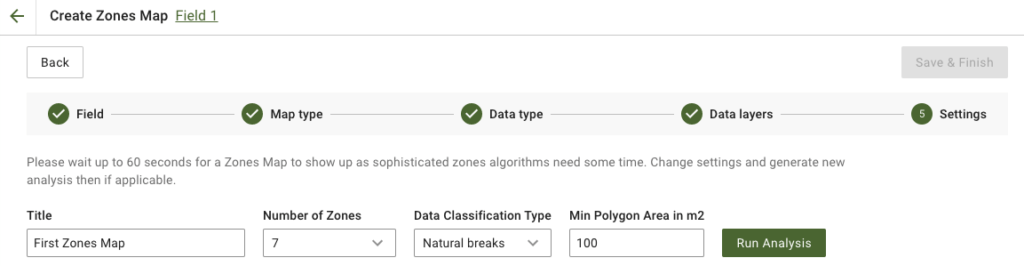
4. I næste trin kan du redigere titlen, ændre antallet af zoner, [vælge en dataklassificeringstype](https://docs.geopard.tech/geopard-tutorials/dnk/produktguide-webapp/zones-maps-and-analytics/using-data-classification.md), og angive det minimale polygonareal i kvadratmeter. Klik på **Kør analyse** for at fortsætte.
Analysen kan tage op til 60 sekunder, afhængigt af de parametre, du har angivet.
5. Når analysen er færdig, skal du klikke på **Gem og afslut**.
Når kortet er gemt, vises følgende meddelelse:
Du kan oprette et nyt zonekort, tildele doseringer eller åbne det zonekort, du lige har oprettet. Hvis du åbner det, vises en lignende visning.
---
# Agent Instructions
This documentation is published with GitBook. GitBook is the documentation platform designed so that both humans and AI agents can read, navigate, and reason over technical content effectively. Learn more at gitbook.com.
## Querying This Documentation
If you need additional information that is not directly available in this page, you can query the documentation by asking a question.
Perform an HTTP GET request on the following URL with the `ask` and `goal` query parameters:
```
GET https://docs.geopard.tech/geopard-tutorials/dnk/produktguide-webapp/zones-maps-and-analytics/create-a-zones-map-using-satellite-imagery.md?ask=&goal=
```
`ask` is the immediate question: it should be specific, self-contained, and written in natural language.
`goal` is what the user is ultimately trying to achieve, the reason they need the answer. Sharing it helps GitBook give you a better, more relevant answer. A goal is most helpful when it describes the outcome the user wants rather than restating the question. For example, with `ask=how do I create an API token`, a goal like `automate deployments from our CI pipeline` lets GitBook tailor the answer to that use case.
The response will contain a direct answer to the question and relevant excerpts and sources from the documentation.
Use this mechanism when the answer is not explicitly present in the current page, you need clarification or additional context, or you want to retrieve related documentation sections.