> For the complete documentation index, see [llms.txt](https://docs.geopard.tech/geopard-tutorials/llms.txt). Markdown versions of documentation pages are available by appending `.md` to page URLs; this page is available as [Markdown](https://docs.geopard.tech/geopard-tutorials/de/produkt-tour-web-app/zones-maps-and-analytics/relative-variation-factor.md).
# Relativer Variationsfaktor
Die räumliche Variation relativ zum Mittelwert quantifizieren, um die Variabilität zwischen Schlägen und Datensätzen zu vergleichen.
Die Erfassung von Veränderungen auf dem Feld im Verlauf der letzten ein bis zwei Wochen, ein bis zwei Monate oder sogar mehrerer Jahre liefert wertvolle Einblicke in die Entwicklung des Bestands.
Der relative Variationsfaktor oder der Relative Variationsindex kann verwendet werden, um:
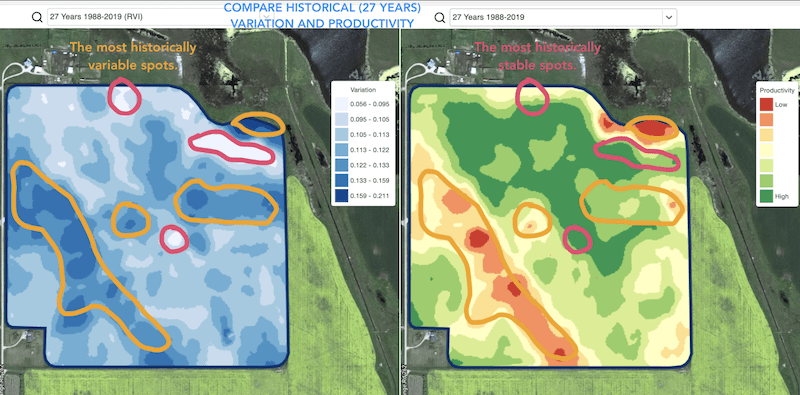
* Bereiche mit ähnlicher Ertragsleistung über einen Zeitraum von 5, 10 oder 20 Jahren zu finden und Versuche unter vergleichbaren Bedingungen anzulegen, um das Fehlerrisiko zu verringern
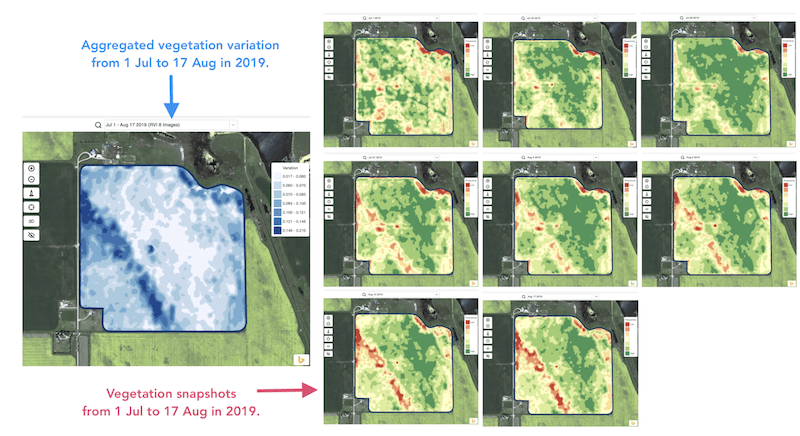
* Veränderungen während der Saison zu verfolgen und die Bestandsentwicklung im Verlauf der Wachstumsphase zu bewerten
* geschädigte Bereiche nach einem Wetterereignis, einer Krankheit oder einem Schädlingsbefall zu erkennen und deren Fläche zu berechnen
* Unterschiede zwischen den letzten beiden Aufnahmen zu erkennen und die Bestandsentwicklung zu überwachen.
Der Relative Variationsindex (RVI) von GeoPard deckt all diese Anwendungsfälle und viele weitere ab. In Kombination mit innerjährlichen und historischen Bewirtschaftungszonen liefert der RVI zusätzliche Einblicke in die Bestandsentwicklung.
Wählen Sie einfach Ihr Feld und die Satellitenaufnahmen aus, um die Veränderungen zu verfolgen und Einblicke in jeden Bereich Ihres Feldes zu erhalten.
---
# Agent Instructions
This documentation is published with GitBook. GitBook is the documentation platform designed so that both humans and AI agents can read, navigate, and reason over technical content effectively. Learn more at gitbook.com.
## Querying This Documentation
If you need additional information that is not directly available in this page, you can query the documentation by asking a question.
Perform an HTTP GET request on the following URL with the `ask` and `goal` query parameters:
```
GET https://docs.geopard.tech/geopard-tutorials/de/produkt-tour-web-app/zones-maps-and-analytics/relative-variation-factor.md?ask=&goal=
```
`ask` is the immediate question: it should be specific, self-contained, and written in natural language.
`goal` is what the user is ultimately trying to achieve, the reason they need the answer. Sharing it helps GitBook give you a better, more relevant answer. A goal is most helpful when it describes the outcome the user wants rather than restating the question. For example, with `ask=how do I create an API token`, a goal like `automate deployments from our CI pipeline` lets GitBook tailor the answer to that use case.
The response will contain a direct answer to the question and relevant excerpts and sources from the documentation.
Use this mechanism when the answer is not explicitly present in the current page, you need clarification or additional context, or you want to retrieve related documentation sections.