> For the complete documentation index, see [llms.txt](https://docs.geopard.tech/geopard-tutorials/llms.txt). Markdown versions of documentation pages are available by appending `.md` to page URLs; this page is available as [Markdown](https://docs.geopard.tech/geopard-tutorials/cze/prohlidka-produktu-webova-aplikace/zones-maps-and-analytics/relative-variation-factor.md).
# Faktor relativní variability
Vyjádřete prostorovou variabilitu vůči průměru a porovnejte proměnlivost napříč poli a sadami dat.
Zjišťování změn, ke kterým na poli došlo během posledního jednoho až dvou týdnů, jednoho až dvou měsíců, nebo dokonce několika let, pomáhá lépe porozumět vývoji plodin.
Faktor relativní variability neboli index relativní variability lze použít k těmto účelům:
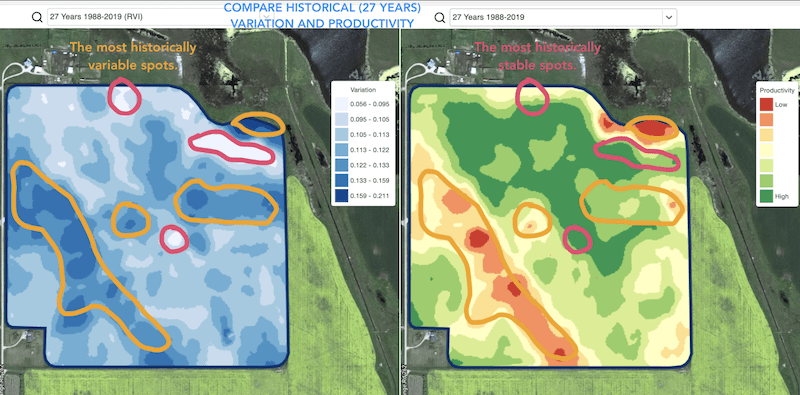
* vyhledání míst s podobnou výkonností za období 5–10–20 let a umístění pokusů do oblastí s podobnými podmínkami, čímž se sníží pravděpodobnost chyby
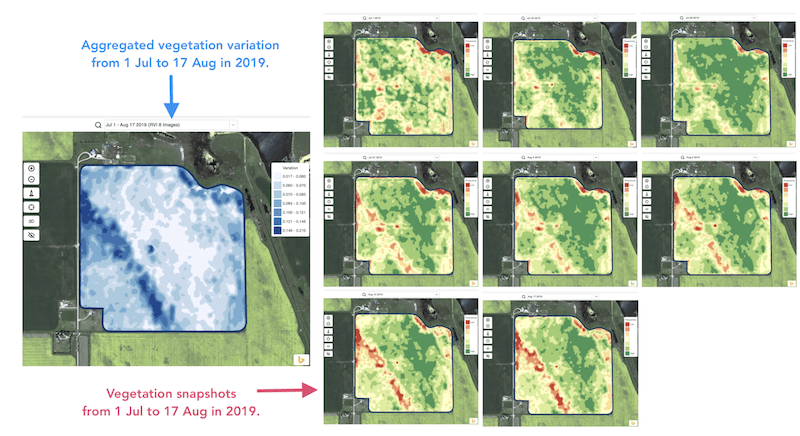
* sledování změn během sezóny a vyhodnocování výkonnosti plodin v průběhu růstu
* rozpoznání poškozených oblastí po živelní pohromě, při výskytu choroby nebo napadení škůdci a výpočet jejich rozsahu
* zjišťování rozdílů mezi posledními dvěma snímky a sledování výkonnosti plodin.
Index relativní variability (RVI) od GeoPard pokrývá všechny tyto případy i mnoho dalších. Při kombinaci s management zónami pro aktuální sezónu i z historických dat vám RVI pomůže lépe porozumět vývoji plodin.
Stačí vybrat pole a satelitní snímky, sledovat změny a získat přehled o každém místě na poli.
---
# Agent Instructions
This documentation is published with GitBook. GitBook is the documentation platform designed so that both humans and AI agents can read, navigate, and reason over technical content effectively. Learn more at gitbook.com.
## Querying This Documentation
If you need additional information that is not directly available in this page, you can query the documentation by asking a question.
Perform an HTTP GET request on the following URL with the `ask` and `goal` query parameters:
```
GET https://docs.geopard.tech/geopard-tutorials/cze/prohlidka-produktu-webova-aplikace/zones-maps-and-analytics/relative-variation-factor.md?ask=&goal=
```
`ask` is the immediate question: it should be specific, self-contained, and written in natural language.
`goal` is what the user is ultimately trying to achieve, the reason they need the answer. Sharing it helps GitBook give you a better, more relevant answer. A goal is most helpful when it describes the outcome the user wants rather than restating the question. For example, with `ask=how do I create an API token`, a goal like `automate deployments from our CI pipeline` lets GitBook tailor the answer to that use case.
The response will contain a direct answer to the question and relevant excerpts and sources from the documentation.
Use this mechanism when the answer is not explicitly present in the current page, you need clarification or additional context, or you want to retrieve related documentation sections.