# Variable Rate Fertilizer Maps

Create a fertilizer Rx map in GeoPard in three parts:

1. Build management zones.
2. Assign fertilizer rates.
3. Export the map to the machine format you need.

<figure><img src="https://3272281156-files.gitbook.io/~/files/v0/b/gitbook-x-prod.appspot.com/o/spaces%2FYICBELdyAXXebKAzfLOR%2Fuploads%2FEIVjVb5rIslAj6STsIdE%2FGeoPard%20options%20to%20create%20Management%20zones%20-%20visual%20selection.png?alt=media&#x26;token=27171b9e-da30-4a23-8b54-d6f8a5acc2e2" alt="GeoPard Field Management Zones workflow" width="375"><figcaption><p>GeoPard workflow for building and using management zones</p></figcaption></figure>

### What you need before you start

* A field boundary in GeoPard.
* At least one data source for zoning.
* A fertilizer plan with target rates, min/max limits, and units.

Good starting data sources:

* Satellite imagery
* Soil sampling or soil scanner data
* Yield maps
* Topography
* As-applied history

{% hint style="info" %}
For a quick first map, start with satellite imagery. For stronger agronomic logic, combine imagery with soil, yield, or topography.
{% endhint %}

### Step-by-step

{% stepper %}
{% step %}

### 1. Open the field and start a zones map

Open the field. Click **Create Zones Map**. Choose **Single-layer** if you want a quick fertilizer map from one source.

<figure><img src="https://lh4.googleusercontent.com/nWK8yT1-6N1eNfd3l4JqQlPeORUFxpFB17Cmt9tNO5z0kL0-GiQWBziMtkVhAxExXq-L-hdQ46DxRG3oD0HVcAIrjSedSo0mlirCy8ol26XpmfVPhcm6d3A5tcYaS6R-ox17j4eC" alt="Start zones map creation"><figcaption><p>
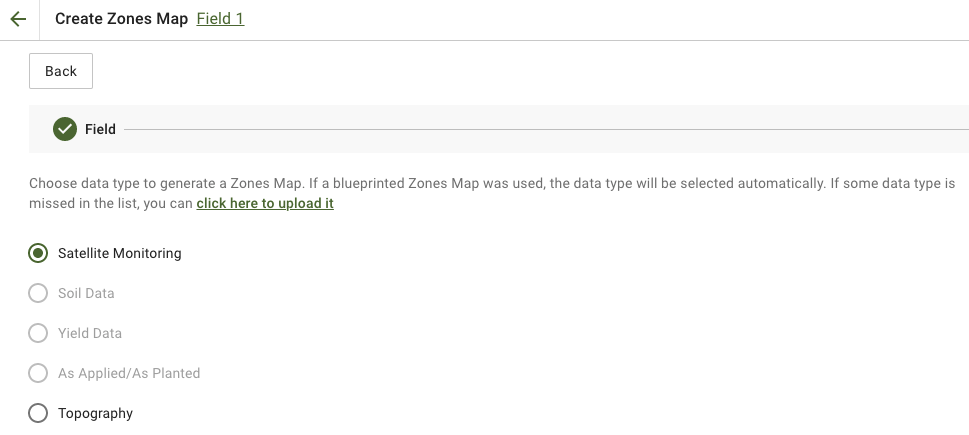
Start creating a zones map from the field page</p></figcaption></figure>
{% endstep %}

{% step %}

### 2. Select the zoning source

Choose the layer that best reflects fertilizer demand.

Common choices:

* **Satellite Monitoring** for biomass or crop vigor patterns
* **Soil data** for pH, EC, organic matter, P, K, Mg, Zn, or other lab values
* **Topography** for slope-driven variability
* **Yield** for productivity response

If you use satellite imagery, pick the most relevant image and index. Then continue.

<figure><img src="https://3272281156-files.gitbook.io/~/files/v0/b/gitbook-x-prod.appspot.com/o/spaces%2FYICBELdyAXXebKAzfLOR%2Fuploads%2F4FFo2DGqVlLFEVc5ktzS%2FGeoPard-Select-layers-for-zones1.png?alt=media&#x26;token=085ad209-7e15-4ff0-8a37-b503bd1e576a" alt="Select the source layers for zoning"><figcaption><p>Select the source layers for zoning</p></figcaption></figure>
{% endstep %}

{% step %}

### 3. Configure the zones

Set the map title, number of zones, classification type, and minimum polygon area.

Practical defaults for fertilizer maps:

* **3-5 zones** for most fields
* **Natural Breaks** when you want stronger rate separation
* **Larger minimum polygon area** when the spreader should avoid tiny polygons

Then click **Run Analysis**.

<figure><img src="https://lh4.googleusercontent.com/878f6ebXLxCLWkJLJ9CiWtSPBoL9o8jj5xuzVZYPXZ5tkwbszYSm-rChnF9sjXZ4z_GbC4eoXISWhMNxwlTyt4LFj6C4aSiD95dqVzTqai4wX203EVBKSimCtRU11AN1UOeFPKdG" alt="Configure zones map"><figcaption><p>
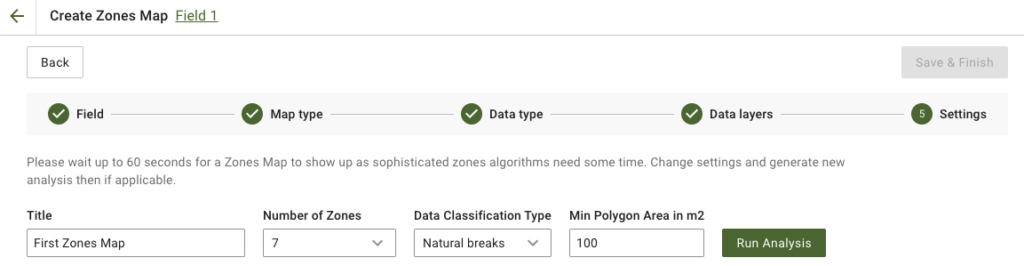
Define zone count, classification, and polygon size</p></figcaption></figure>
{% endstep %}

{% step %}

### 4. Save the zones map

Wait until the analysis finishes. Review the result. Then click **Save & Finish**.

<figure><img src="https://lh5.googleusercontent.com/Wy3hKvKLj6QPVO4qC9xjYCmNZiI3cUXMFQhAHv4OwnWy_p4o216zZ1hH09kAXLcUUAaoWJzakeruCu-pBIZAQq7Tta4hjU1jsHV2IrEjqZsG_IS1Fhn1Y_Dd58GsXCRovOuYv2rL" alt="Save zones map"><figcaption><p>Save the finished zones map</p></figcaption></figure>

After saving, open the new zones map.

<figure><img src="https://lh4.googleusercontent.com/7PEbZc-c_CLsDI_Sut1hjYUHSGUWbBIvHwe6r-1wW9awahM5nC03nCMAMd6uCCQU5JHOvOFiKK9bpjlXUFx0ZHZrVSoOe4v354TRx3LupmB7JEqea6tl7o1zC_NAhSLvnT1pB8J4" alt="Saved zones map"><figcaption><p>Open the saved zones map to assign fertilizer rates</p></figcaption></figure>
{% endstep %}

{% step %}

### 5. Assign fertilizer rates

Use the **Rates Distribution Tool** to convert zones into a fertilizer prescription.

Typical setup:

* Select the fertilizer product
* Set the unit, such as `kg/ha`, `lb/ac`, or `l/ha`
* Choose **Average Value** or **Total Amount**
* Define how much rates should change between low and high zones
* Add min and max limits if needed
* Review totals and savings
* Click **Save**

{% embed url="<https://youtu.be/n50pPdFQF0U>" %}
GeoPard Rates Distribution Tool
{% endembed %}

{% hint style="success" %}
Use higher rates in stronger zones when the crop can respond more. Use reverse logic when low-productivity zones need more correction, like lime or some base nutrients.
{% endhint %}
{% endstep %}

{% step %}

### 6. Optional: add trial blocks or strips

If you want to test fertilizer rates in the same pass, add trial layouts directly on the Zones Map page.

What you can do:

* draw trial **strips** or **blocks** on top of the fertilizer zones map
* assign different fertilizer treatments or rates to each trial area
* set replications, angle, width, buffer, and block structure
* shuffle treatment placement to reduce positional bias
* keep trials as a geospatial layer linked to the exact field position

This is useful when you want to compare rates in real field conditions instead of relying only on field averages.

<figure><img src="https://docs.geopard.tech/geopard-tutorials/~gitbook/image?url=https%3A%2F%2F3272281156-files.gitbook.io%2F~%2Ffiles%2Fv0%2Fb%2Fgitbook-x-prod.appspot.com%2Fo%2Fspaces%252FYICBELdyAXXebKAzfLOR%252Fuploads%252Fe2NDAomS4noMGaJIHtcq%252FRCBD%2520-%2520Plot%2520grids%2520trials.png%3Falt%3Dmedia%26token%3D65aa28a0-1e95-4f53-b27c-fd3af02f226c&#x26;width=752&#x26;dpr=2&#x26;quality=100&#x26;sign=c9fa51d9&#x26;sv=2" alt="RCBD plot grid trial layout over a zones map with multiple fertilizer or seeding treatments assigned by block"><figcaption><p>Example of RCBD trial blocks placed directly on top of a zones map</p></figcaption></figure>

Match trial width and angle to machine width and travel direction for cleaner execution and better analysis later.

{% hint style="info" %}
Trials stay linked to the zones map. You can visualize them on the field, reuse trial locations later, and export trials merged with the zones map in one application-ready file.
{% endhint %}
{% endstep %}

{% step %}

### 7. Export the fertilizer map

From the zones map page, click **Export** and choose the format required by your terminal or platform.

ISOXML is the common option for machine-ready fertilizer prescriptions.

If you send prescriptions to John Deere, use these tutorials:

* [Export Rx Maps to John Deere Operations Center as Files](https://docs.geopard.tech/geopard-tutorials/product-tour-web-app/john-deere-operations-center-integration/6.-export-rx-maps-to-john-deere-operations-center-as-files)
* [Export Rx Maps to John Deere Operations Center as Work Plans](https://docs.geopard.tech/geopard-tutorials/product-tour-web-app/john-deere-operations-center-integration/8.-export-rx-maps-to-john-deere-operations-center-as-work-plans)

<figure><img src="https://3272281156-files.gitbook.io/~/files/v0/b/gitbook-x-prod.appspot.com/o/spaces%2FYICBELdyAXXebKAzfLOR%2Fuploads%2FDHWnGnsyA2vlZRTR6tKR%2Fimage.png?alt=media&#x26;token=ed313e5d-c8df-4801-919a-2484b81a97b9" alt="Open zones map for export"><figcaption><p>Open the zones map page</p></figcaption></figure>

<figure><img src="https://3272281156-files.gitbook.io/~/files/v0/b/gitbook-x-prod.appspot.com/o/spaces%2FYICBELdyAXXebKAzfLOR%2Fuploads%2F838iCmgcHO8INqOdWezT%2Fimage.png?alt=media&#x26;token=7575e164-dcb6-4606-99da-b4a0819cff0f" alt="Export zones map"><figcaption><p>Click Export</p></figcaption></figure>

<figure><img src="https://3272281156-files.gitbook.io/~/files/v0/b/gitbook-x-prod.appspot.com/o/spaces%2FYICBELdyAXXebKAzfLOR%2Fuploads%2FKexEZ63QobUbUe6i82hJ%2Fimage.png?alt=media&#x26;token=36629fa2-f32b-4111-9537-826eae6b9921" alt="Download ISOXML"><figcaption><p>Download ISOXML</p></figcaption></figure>

<figure><img src="https://3272281156-files.gitbook.io/~/files/v0/b/gitbook-x-prod.appspot.com/o/spaces%2FYICBELdyAXXebKAzfLOR%2Fuploads%2FmMF6lujMx4oggjBSxDtT%2FScreenshot%202023-03-11%20at%2002.10.07.png?alt=media&#x26;token=9f0eed31-4922-484e-893c-ef2e8621db7d" alt="ISOXML zip result"><figcaption><p>The downloaded ZIP includes ISOXML variants for different monitors</p></figcaption></figure>
{% endstep %}
{% endstepper %}

### Optional: start from existing as-applied fertilizer data

If you already have an application dataset, upload it first and use it as a zoning source or reference layer.

<figure><img src="https://3272281156-files.gitbook.io/~/files/v0/b/gitbook-x-prod.appspot.com/o/spaces%2FYICBELdyAXXebKAzfLOR%2Fuploads%2FH8VnyWgIpoF6vuphGMcy%2Fimage.png?alt=media&#x26;token=ad1f371f-5bf9-4b83-b1bc-011de9763bf1" alt="Upload as-applied shapefile"><figcaption><p>Upload fertilizer application data as a shapefile</p></figcaption></figure>

This is useful when you want to:

* rebuild a better fertilizer map from previous operations
* compare target rates with applied rates later
* create follow-up nutrient maps from real machinery data

### Best practices for fertilizer VRT maps

* Keep the first version simple. Use 3-5 zones.
* Avoid very small polygons unless the machine can handle them.
* Match units to the terminal before export.
* Set min and max rates to stay within agronomic and machine limits.
* Use field trials or post-season analysis to improve the map next year.

### Related pages

* [Field Management Zones (Productivity Zones) Creation Process](https://docs.geopard.tech/geopard-tutorials/agronomy/field-management-zones-productivity-zones-creation-process)
* [Assign Variable Rates in the Zones (Ag inputs Rates Distribution Tool)](https://docs.geopard.tech/geopard-tutorials/product-tour-web-app/zones-maps-and-analytics/assign-variable-rates-in-the-zones-ag-inputs-rates-distribution-tool)
* [Field Trial Analytics](https://docs.geopard.tech/geopard-tutorials/agronomy/field-trial-analytics)
* [Export VRA map In ISOXML Format](https://docs.geopard.tech/geopard-tutorials/product-tour-web-app/export-download/export-vra-map-in-isoxml-format)
* [Export Rx Maps to John Deere Operations Center as Files](https://docs.geopard.tech/geopard-tutorials/product-tour-web-app/john-deere-operations-center-integration/6.-export-rx-maps-to-john-deere-operations-center-as-files)
* [Export Rx Maps to John Deere Operations Center as Work Plans](https://docs.geopard.tech/geopard-tutorials/product-tour-web-app/john-deere-operations-center-integration/8.-export-rx-maps-to-john-deere-operations-center-as-work-plans)
* [Evaluate Accuracy of Fertilizer Application](https://docs.geopard.tech/geopard-tutorials/agronomy/evaluate-accuracy-of-fertilizer-application)
